empty
 
 
11.07.2025 08:43 AM
How to Trade GBP/USD on July 11h? Simple Tips and Trade Analysis for Beginners
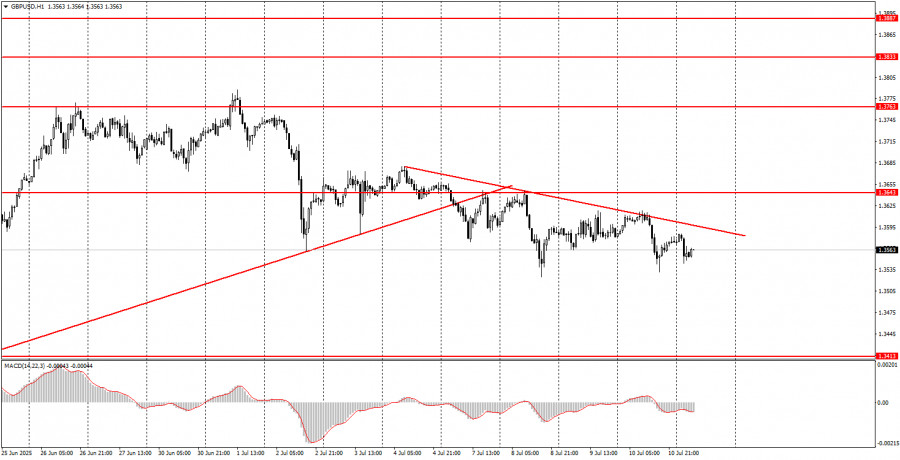
Thursday Trade Review: GBP/USD, 1H Chart

This image is no longer relevant

On Thursday, the GBP/USD pair continued its downward movement, mirroring the EUR/USD pair. The behavior of these two major currency pairs was nearly identical. There was no significant macroeconomic background for the British currency this week, similar to the situation for the euro and the U.S. dollar. A few secondary reports were released but had no impact on trader activity. Thus, the hourly chart maintains a bearish trend, as confirmed by the downward trendline. A breakout above this line would signal the end of the current corrective trend. It's also worth noting that recent price lows have been forming within the same range. The U.S. dollar is strengthening gradually, and there are reasons for that. This week, Donald Trump escalated the trade conflict, which has not gone unnoticed. However, the current movement is part of a technical correction, and there are no signs of its completion yet.

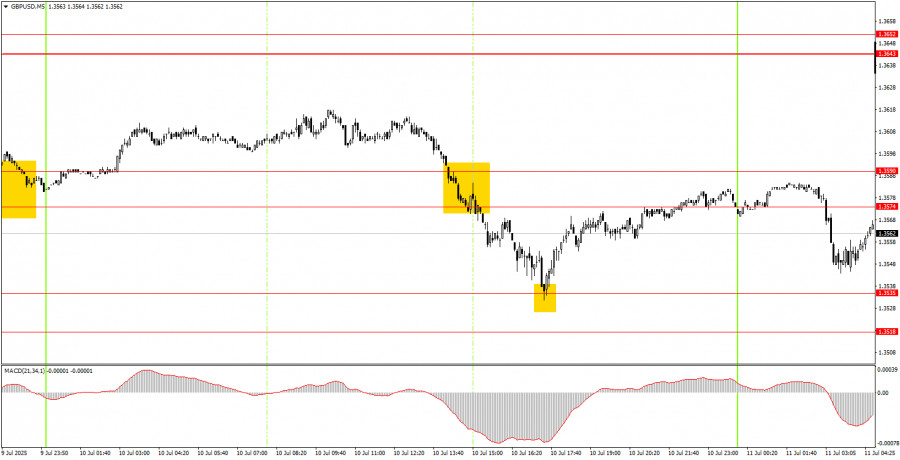
GBP/USD, 5M Chart

This image is no longer relevant

On the 5-minute chart, two solid trading signals were generated on Thursday. At the start of the U.S. session, the price broke through the 1.3574–1.3590 level, reached the 1.3535 level, rebounded from it, and returned to the 1.3574–1.3590 level. This allowed beginner traders to open short positions first, then long positions. Both trades could have yielded around 25 points of profit.

How to Trade on Friday:

On the hourly chart, GBP/USD experienced a sharp drop last week, after which the dollar's rally paused. Over the past six days, the U.S. dollar has shown only slight appreciation. In fact, the dollar only strengthened meaningfully on one day over the past two weeks, despite a number of strong reports from the U.S. This suggests that traders are still reluctant to buy the dollar under current conditions. The present movement appears to be a technical correction.

On Friday, the GBP/USD pair may continue to move downward, as the bearish trend remains intact. A breakout above the trendline would indicate its completion.

On the 5-minute chart, trading can be done using the following levels: 1.3203–1.3211, 1.3259, 1.3329–1.3331, 1.3413–1.3421, 1.3518–1.3535, 1.3574–1.3590, 1.3643–1.3652, 1.3682, 1.3763, 1.3814–1.3832.On Friday, the UK will publish GDP and industrial production data for May. These are not the most critical reports, but they are the first relatively meaningful data this week. A market reaction is possible, though likely limited. We recommend that beginner traders monitor the 1.3535 level. A rebound from it could be a signal to open long positions.

Basic Trading System Rules:

  1. Signal strength is judged by the time it takes for the signal to form (rebound or breakout). The less time it takes, the stronger the signal.
  2. If two or more false signals were generated near a particular level, subsequent signals from that level should be ignored.
  3. In flat (sideways) markets, many false signals may form or none at all. At the first signs of flat conditions, it's better to stop trading.
  4. Trades should be opened between the start of the European session and the middle of the U.S. session; all trades should be manually closed after that.
  5. On the hourly chart, trade MACD signals only when there is good volatility and a trend confirmed by a trendline or trend channel.
  6. If two levels are too close together (5 to 20 points), treat them as a support or resistance zone.
  7. After a 20-point move in the correct direction, move Stop Loss to breakeven.

Chart Notes:

  • Support and resistance levels are target points for opening buy/sell positions. Take Profit levels can be placed near them.
  • Red lines indicate trendlines or channels and show the preferred trading direction.
  • MACD (14, 22, 3) consists of a histogram and signal line and is used as an auxiliary signal source.
  • Key speeches and reports (always listed in the economic calendar) can significantly affect price movement. It's recommended to trade cautiously or stay out of the market during such releases to avoid sudden reversals.

Beginner Forex traders should remember that not every trade will be profitable. A clearly defined strategy and sound money management are essential for long-term success.

Paolo Greco,
ইন্সটাফরেক্সের বিশ্লেষণ বিশেষজ্ঞ
© 2007-2025
Summary
Urgency
Analytic
Stanislav Polyanskiy
Start trade
ইনস্টাফরেক্স দিয়ে ক্রিপ্টোমুদ্রা দর পরিবর্তনে আয় করুন।
মেটাট্রেডার 4 ডাউনলোড করে আপনার প্রথম ট্রেড চালু করুন।
  • Grand Choice
    Contest by
    InstaForex
    InstaForex always strives to help you
    fulfill your biggest dreams.
    প্রতিযোগীতায় অংশগ্রহণ করুন
  • চ্যান্সি ডিপোজিট
    আপনার অ্যাকাউন্টে $3,000 জমা করুন এবং $4000 এর অধিক নিন!
    চ্যান্সি ডিপোজিট প্রচারাভিযানে আমরা জুলাই $4000 লটারি করেছি! একটি ট্রেডিং অ্যাকাউন্টে $3,000 জমা করে এই অর্থ জেতার একটি সুযোগ নিন! এই শর্ত পূরণ করে, আপনি একজন অংশগ্রহণকারী হতে পারবেন।
    প্রতিযোগীতায় অংশগ্রহণ করুন
  • বুদ্ধিমত্তার সাথে ট্রেড করুন, ডিভাইস জিতুন
    আপনার অ্যাকাউন্টে কমপক্ষে $৫০০ টপ আপ করুন, প্রতিযোগিতার জন্য সাইন আপ করুন এবং মোবাইল ডিভাইস জেতার সুযোগ পান।
    প্রতিযোগীতায় অংশগ্রহণ করুন
  • ১০০% বোনাস
    আপনার ডিপোজিটের উপর ১০০% বোনাস পাওয়ার অনন্য সুযোগ
    বোনাস পান
  • ৫৫% বোনাস
    আপনার অ্যাকাউন্টে প্রতিটি ডিপোজিটের উপর ৫৫% বোনাসের জন্য আবেদন করুন
    বোনাস পান
  • ৩০% বোনাস
    প্রতিবার আপনার অ্যাকাউন্ট টপ আপ করার সময় ৩০% বোনাস নিন
    বোনাস পান

সুপারিশকৃত নিবন্ধ

এখন কথা বলতে পারবেন না?
আপনার প্রশ্ন জিজ্ঞাসা করুন চ্যাট.
Widget callback