EUR/USD 5-Minute Analysis
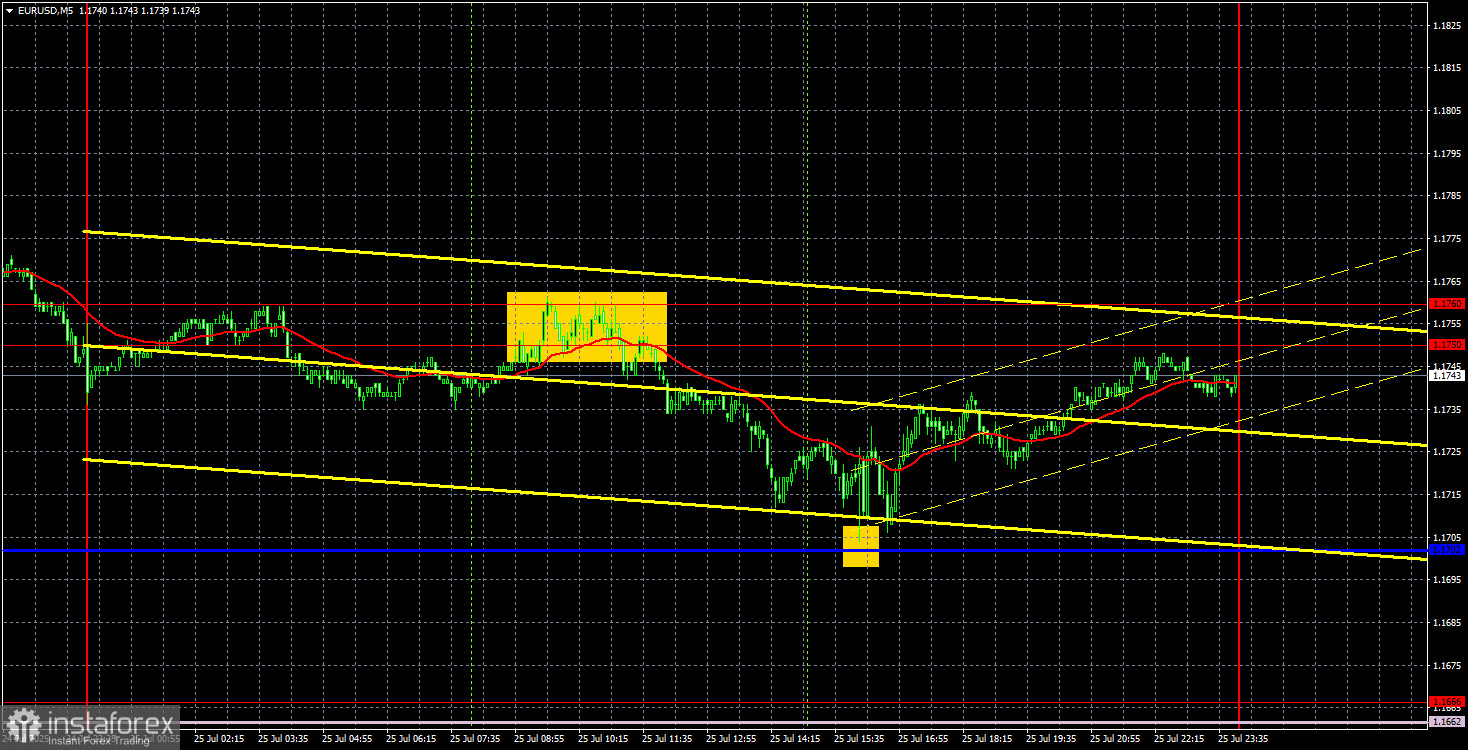
On Friday, the EUR/USD currency pair once again traded with low volatility but demonstrated nearly perfect technical behavior. There was little news during the day, with the only noteworthy report being on durable goods orders, which gave mixed signals. On one hand, the actual figure was better than the forecast. On the other hand, the number of orders in June dropped by 9.3%, which is quite significant. Thus, this report cannot be considered positive. Traders themselves were unsure how to interpret the data. After its release, the pair became volatile, but it was the rebound from the critical line — not the macroeconomic data — that held key significance for the dollar.
From a technical perspective, the local uptrend remains in place. Last week, the price saw a slight downward correction, but forming a proper trend line or channel is still not possible — the second extremum is missing. The price failed to consolidate below the critical line, so we expect a new wave of euro growth on Monday.
On the 5-minute timeframe, Friday produced two nearly perfect trading signals. First, the price bounced precisely from the 1.1750–1.1760 zone, then dropped to the Kijun-sen line of the Ichimoku indicator, and rebounded from that line with a small deviation (2 points), eventually returning to the 1.1750–1.1760 area by the end of the day. This allowed traders to first open short positions, then long positions — both of which turned out to be profitable.
COT Report
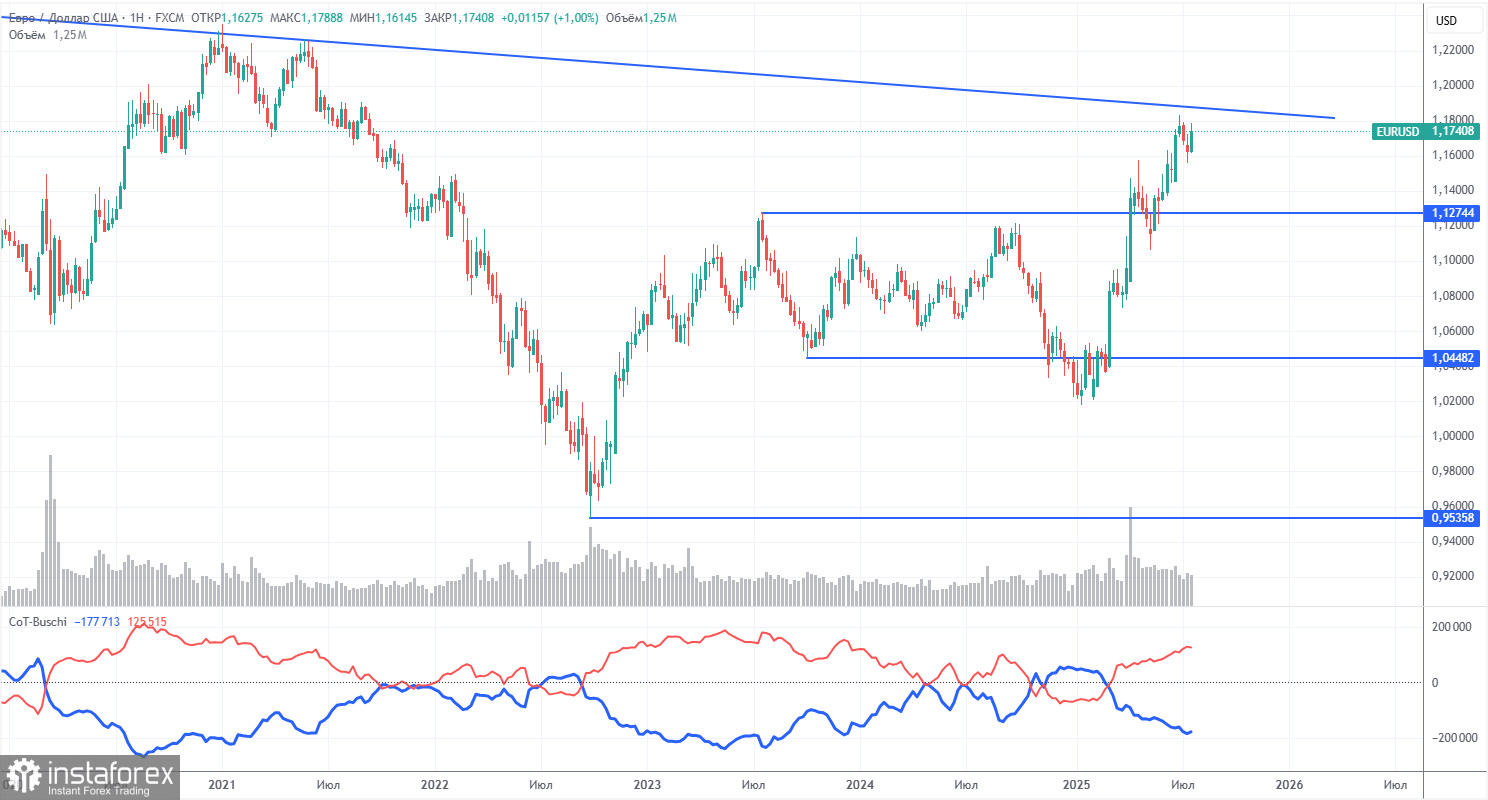
The latest COT (Commitment of Traders) report is dated July 22. As shown in the chart above, the net position of non-commercial traders was bullish for a long time. Bears barely took control at the end of 2024, but quickly lost it. Since Trump took office as President of the U.S., the dollar has only declined. While we can't say with 100% certainty that this decline will continue, current global developments suggest this scenario is likely.
We still see no fundamental factors supporting the euro, but one strong factor remains weighing on the U.S. dollar. The global downtrend remains intact, but what does it matter where the price has moved over the last 16 years? Once Trump ends his trade wars, the dollar may begin to rise — but when will that happen?
The position of the red and blue lines in the indicator continues to show a bullish trend. During the last reporting week, long positions held by the "Non-commercial" group increased by 6,200, while shorts increased by 8,900. Therefore, the net position decreased by 1,700 contracts — a negligible change.
EUR/USD 1-Hour Analysis
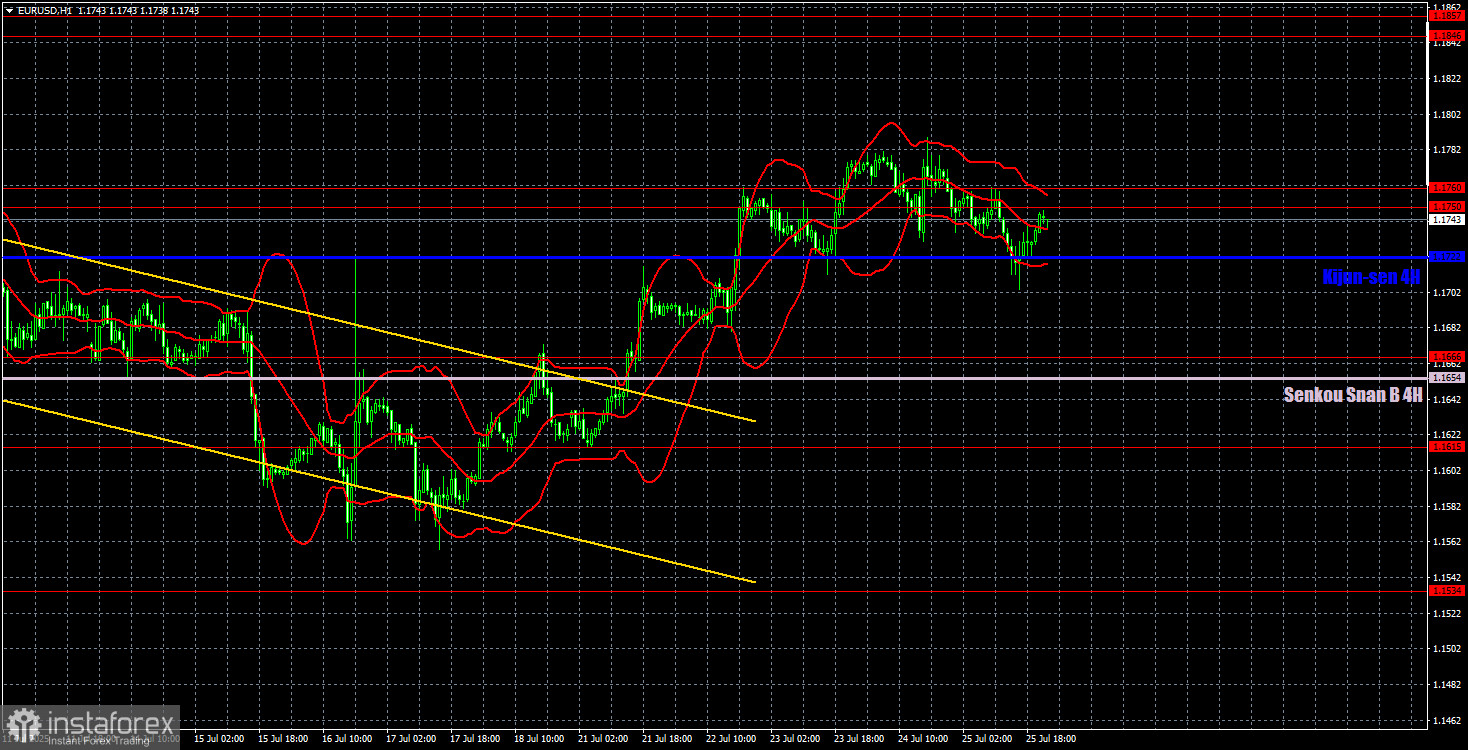
On the hourly timeframe, the EUR/USD pair continues forming a new upward trend. Trump continues to raise and introduce new tariffs, and the prospect of him signing any trade deals with countries on his "blacklist" seems less likely by the day. Without trade deals, the trade war will escalate further, and even with deals, it will likely continue, as all of Trump's tariffs remain in force.
For July 28, we highlight the following levels for trading: 1.1092, 1.1147, 1.1185, 1.1234, 1.1274, 1.1362, 1.1426, 1.1534, 1.1615, 1.1666, 1.1750–1.1760, 1.1846–1.1857, as well as Senkou Span B (1.1654) and Kijun-sen (1.1722) lines. Ichimoku lines may shift during the day, which should be taken into account when identifying trading signals. Don't forget to place the Stop Loss order to break even if the price moves 15 pips in your favor — this will protect you in case of a false signal.
There are no major economic reports or events scheduled in either the Eurozone or the U.S. on Monday. Therefore, the euro may continue to rise, but volatility is likely to remain low.
Trading Recommendations
On Monday, both upward and downward movement are possible. An upward move is possible because the price failed to break the critical line on Friday. A downward move could happen if the pair fails to break through the 1.1750–1.1760 area on Monday. Therefore:
- A rebound from the 1.1750–1.1760 zone would allow for opening short positions with targets at 1.1722 and slightly below.
- A break and consolidation above 1.1750–1.1760 would allow for opening long positions with targets at 1.1846–1.1857.
Illustration Explanations:
- Support and resistance price levels – thick red lines where movement may end. They are not trading signal sources.
- Kijun-sen and Senkou Span B lines—These are strong Ichimoku indicator lines transferred to the hourly timeframe from the 4-hour one.
- Extremum levels – thin red lines where the price has previously rebounded. These act as trading signal sources.
- Yellow lines – trend lines, trend channels, and other technical patterns.
- COT Indicator 1 on the charts – the size of the net position for each category of traders.