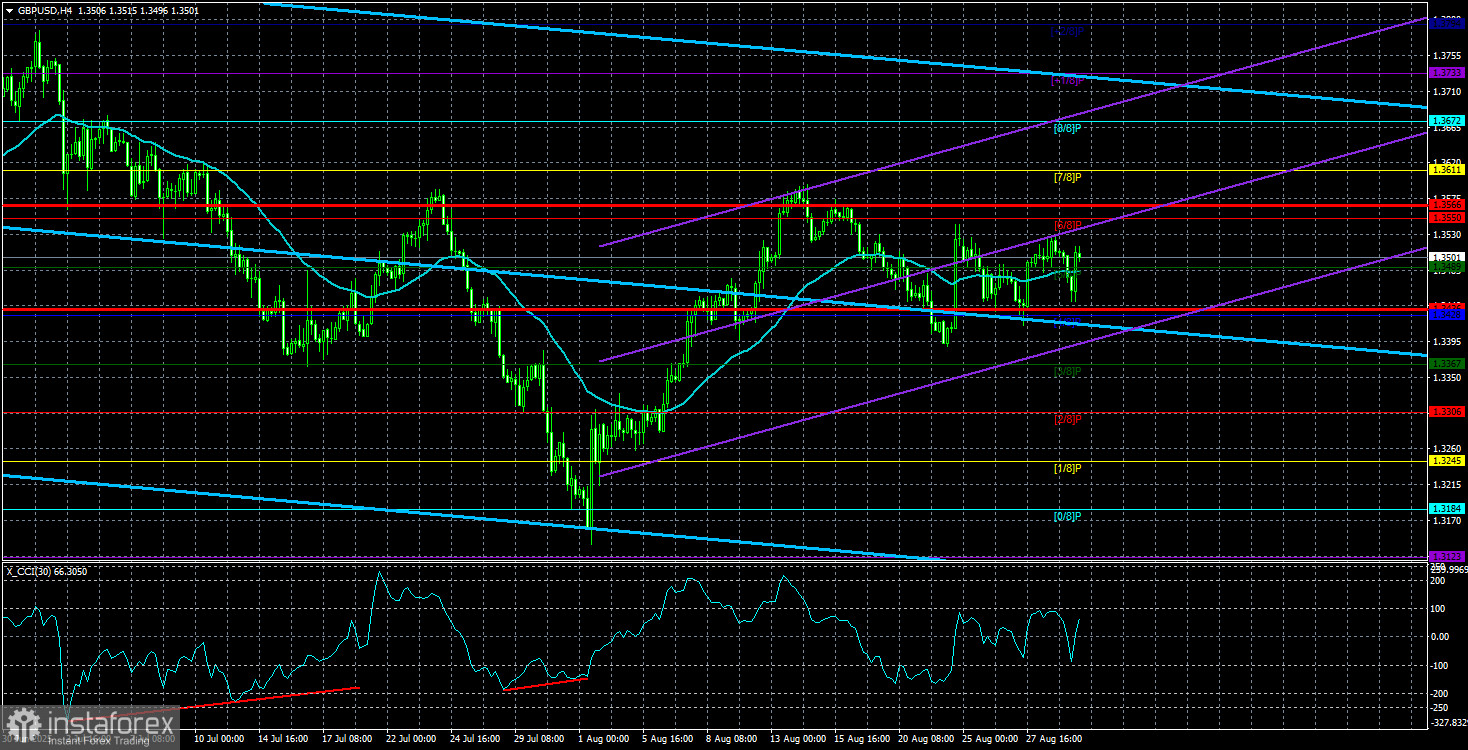
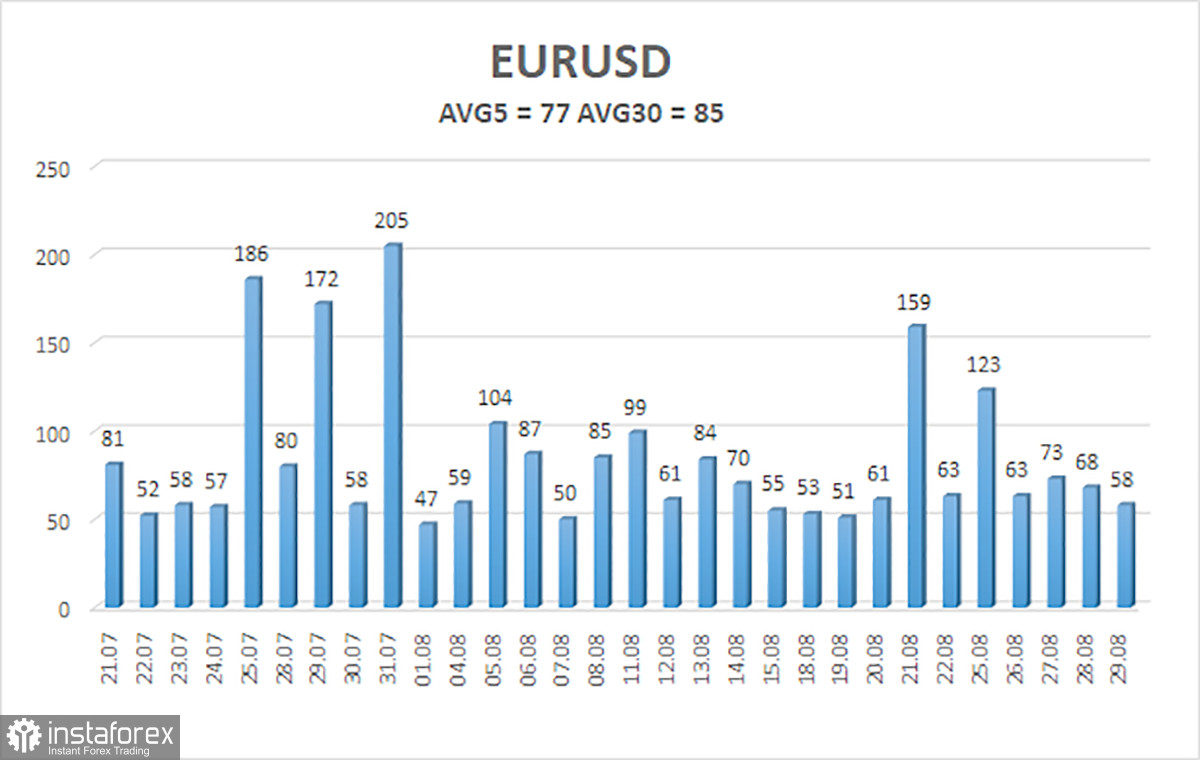
The GBP/USD currency pair traded sideways with minimal volatility last week. As shown in the chart below, the average volatility over the past five days was 65 pips, which is very low for the British pound. There were no trend movements, which is also clearly visible in the chart above. The market remains bullish—there's really no alternative at the moment. Of course, a new corrective wave may begin, even this week, simply because US data may surprise to the upside for the dollar. For example, if the US labor market recovers after a three-month slump and the ISM business activity indices rise, that would provide local support for the dollar. However, over the medium term, such gifts will not have a significant impact.
The global factors driving the dollar's decline haven't gone anywhere; in fact, they have gained new dimensions and nuances. This week, the question will be resolved: will the dollar continue its corrective rally, based on the prospect of unchanged Federal Reserve monetary policy for another month and a half, or is it time for a new long-term decline of the US dollar?
There will be a few important events and reports in the UK, and objectively, they have very little significance for traders. The pound remains a beneficiary of the dollar's decline, hardly making any effort to grow on its own. The UK economy isn't expanding rapidly, and problems have persisted since 2016 when, by a narrow margin, the public voted in the Brexit referendum to leave the EU. The only notable release will be the retail sales report, scheduled for release on Friday.
The US, on the other hand, will see many more significant events. On Tuesday, the ISM Manufacturing PMI will be published, which has remained below the "waterline" of 50.0 for six consecutive months. It's unlikely the situation improved much in August.
On Thursday, the ISM Services PMI will be released; it is currently on the verge of a breakdown. In July, the index fell to 50.1, and business activity has declined by 5.6 points since last October. If August records another decline, the index will fall below 50.0, where any value is considered negative.
PMIs are important, but the key data will be released on Friday: Nonfarm Payrolls and the unemployment rate. Unemployment is expected to rise to 4.3%, and NonFarm employment is forecast at 78,000. Recall that the "normal" number for NonFarms is 200,000 per month. However, the main point is not the "normal" value, but how the actual figure compares to the forecast. If at least 100,000 jobs were created, it would exceed the estimates and be nearly as many as the total for the last three months combined. Additionally, data from previous months can be revised in either direction.
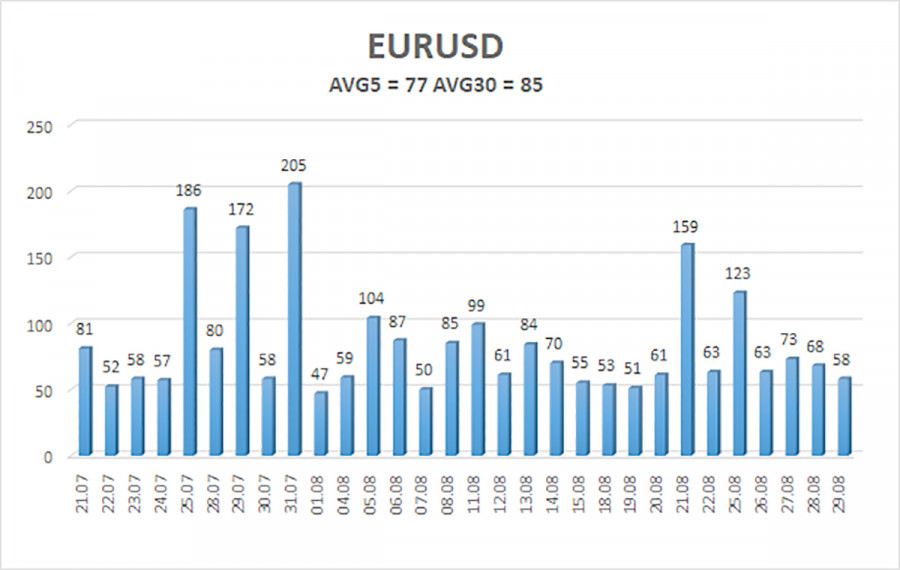
The average volatility for GBP/USD over the last five trading days is 65 pips. For the pound/dollar pair, this is "medium-low". On Monday, September 1, we expect movement within a range defined by 1.3436 to 1.3566. The upper channel of linear regression is pointing upward, indicating a clear uptrend. The CCI indicator has entered the oversold zone twice, signaling a potential resumption of the uptrend each time. Several bullish divergences have formed ahead of a potential new growth phase.
Nearest Support Levels:
S1 – 1.3489
S2 – 1.3428
S3 – 1.3367
Nearest Resistance Levels:
R1 – 1.3550
R2 – 1.3611
R3 – 1.3672
Trading Recommendations:
The GBP/USD pair has completed another downward corrective wave. In the medium term, Trump's policies are likely to continue putting pressure on the dollar. Thus, long positions targeting 1.3611 and 1.3672 remain much more relevant as long as the price is above the moving average. If the price is below the moving average, consider small shorts on a technical basis only. The US currency corrects from time to time, but for a sustained trend reversal, it needs real signs that the global trade war has truly ended—or other major positive factors.
Chart Elements Explained:
- Linear regression channels help determine the current trend. If both channels point in the same direction, the trend is strong.
- The moving average line (settings 20,0, smoothed) indicates the short-term trend and trade direction.
- Murray levels serve as target levels for moves and corrections.
- Volatility levels (red lines) are the likely price channel for the next day, based on current volatility readings.
- The CCI indicator: dips below -250 (oversold) or rises above +250 (overbought) mean a trend reversal may be near.