GBP/USD 5-Minute Analysis
Unlike the EUR/USD pair, the GBP/USD currency pair steadily continued its upward movement on Wednesday. There were no significant macroeconomic events in either the U.S. or the UK during the day; however, the market continued to increase its purchases of the pound and sell the dollar. We have already discussed the reasons many times—they are global and long-term. So, if you see another dollar drop on a "quiet day," it should come as no surprise—it's completely logical. Traders continue to rate Donald Trump's trade, foreign, and domestic policies poorly. Perhaps the U.S. stock market is rising despite Trump's policies, but in this case, the market deals with private companies focused on maximizing profits. Here, however, we're talking about a national currency, which is directly influenced by political and economic factors. The market consistently reflects its views on current developments in the U.S.
Thus, we see no reason for the uptrend—which began on the very day Trump became president—to end—the deeper into the woods, the more firewood. Now the U.S. president wants to impose tariffs not only on countries from his "blacklist" but on every other nation on Earth. If there were aliens somewhere in the universe, Trump would likely try to impose tariffs on them as well.
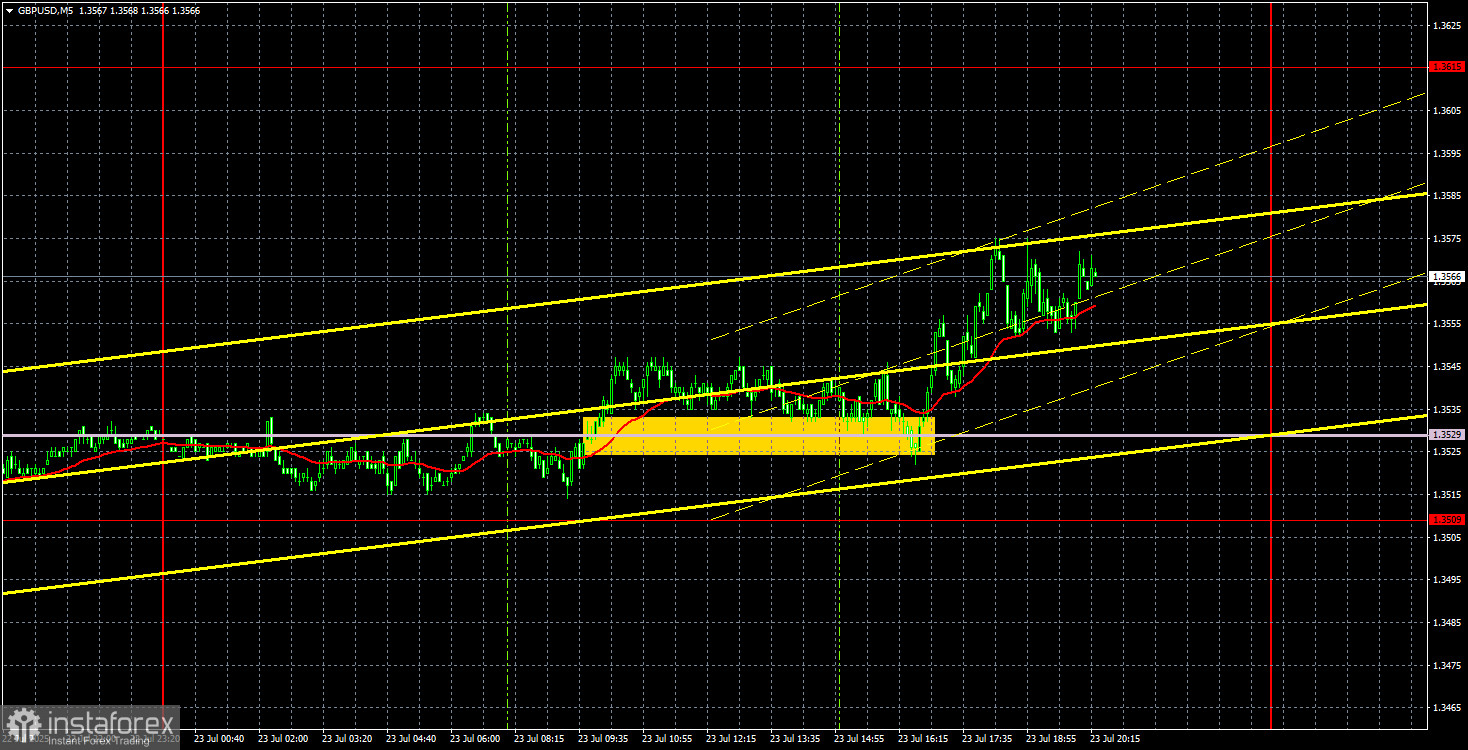
Regarding trading signals, we can note only a breakout and a rebound from the Senkou Span B line. These signals overlapped, so only one trade could have been opened. It can't be said that it brought in huge profit, as the nearest target was relatively far away, and by the end of the day, prices began to decline. Nevertheless, it was certainly not a losing trade.
COT Report
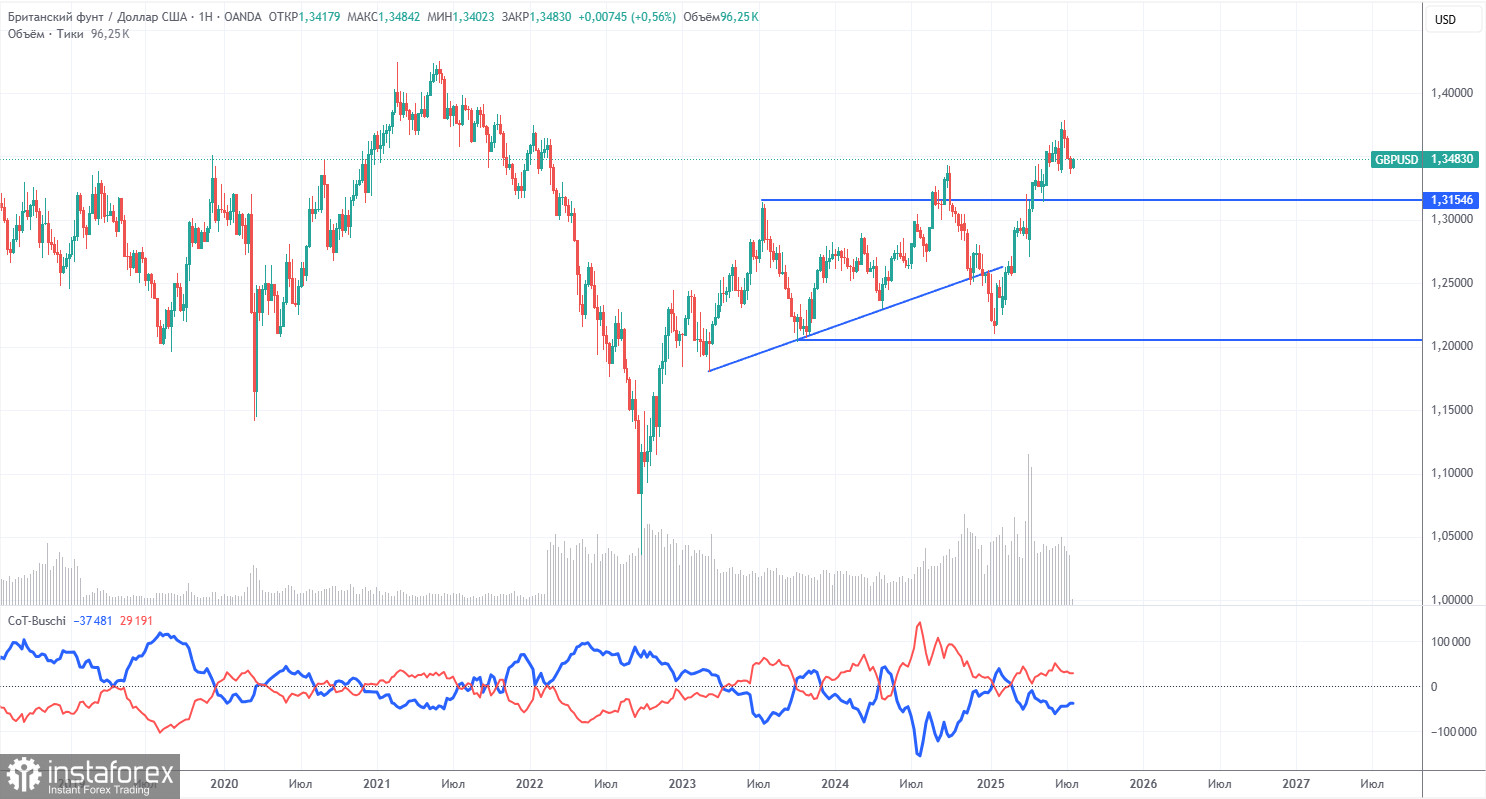
COT reports on the British pound show that over the past few years, the sentiment of commercial traders has changed frequently. The red and blue lines—representing the net positions of commercial and non-commercial traders—cross each other regularly and tend to hover near the zero mark. Currently, they are also located close together, which indicates a roughly equal number of buy and sell positions. However, over the past year and a half, the net position has been growing and in recent months has remained bullish.
The dollar continues to weaken due to Donald Trump's policies; therefore, in principle, market makers' demand for the pound sterling is not particularly significant at present. The trade war, in one form or another, is likely to persist for an extended period, and demand for the dollar is expected to continue declining. According to the latest report on the British pound, the "Non-commercial" group closed 7,000 BUY contracts and 3,000 SELL contracts. As a result, the net position of non-commercial traders declined by 4,000 contracts over the reporting week.
In 2025, the pound has risen sharply—but this is due to one key reason: Trump's policy. Once this factor is neutralized, the dollar may return to growth—but when that will happen, no one knows. The pace of growth in the net position for the pound is not particularly relevant at this time. What matters is that the dollar's net position is declining much faster.
GBP/USD 1-Hour Analysis
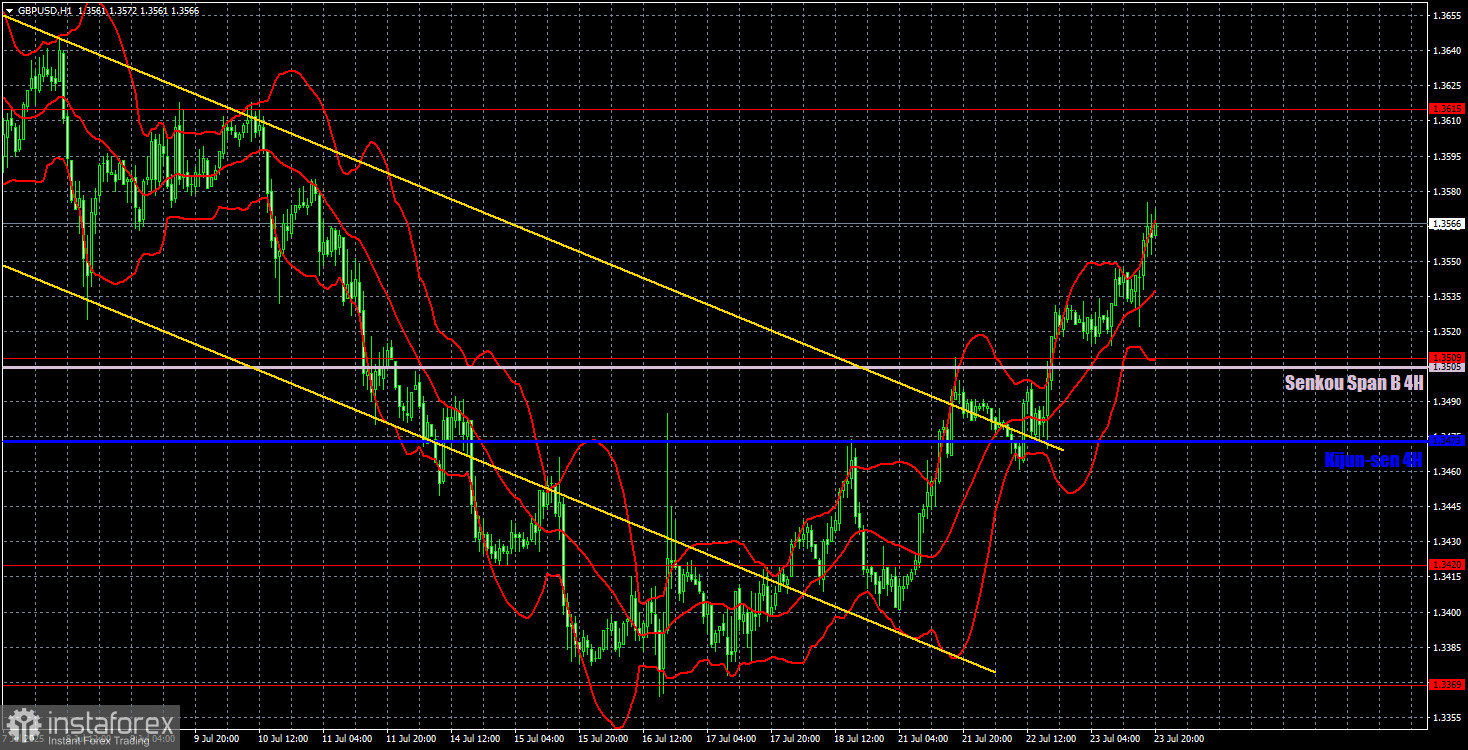
On the hourly timeframe, the GBP/USD pair has begun forming a new, local uptrend, which is likely to become part of a broader upward trend. Trump's policy remains unchanged—tariffs continue to be imposed, and pressure on Jerome Powell persists. The market had no reason to buy the U.S. dollar before, and every new week only strengthens that sentiment.
For July 24, we highlight the following key levels: 1.3125, 1.3212, 1.3369, 1.3420, 1.3509, 1.3615, 1.3741–1.3763, 1.3833, 1.3886. The Senkou Span B line (1.3505) and the Kijun-sen line (1.3473) may also act as signal sources. A Stop Loss level is recommended to be moved to breakeven once the price moves 20 pips in the favorable direction. The Ichimoku indicator lines may shift throughout the day, so this should be taken into account when determining trading signals.
On Thursday, the UK and the U.S. will publish business activity indices for the services and manufacturing sectors. These are not the most important data releases, especially for the U.S., where internal ISM indices are more relevant. No other events are scheduled for the day, but the European Central Bank meeting results may still impact the GBP/USD pair. However, no major decisions are expected from the ECB at its July meeting.
Illustration Explanations:
- Support and resistance price levels – thick red lines where movement may end. They are not trading signal sources.
- Kijun-sen and Senkou Span B lines—These are strong Ichimoku indicator lines transferred to the hourly timeframe from the 4-hour one.
- Extremum levels – thin red lines where the price has previously rebounded. These act as trading signal sources.
- Yellow lines – trend lines, trend channels, and other technical patterns.
- COT Indicator 1 on the charts – the size of the net position for each category of traders.