GBP/USD 5-Minute Analysis
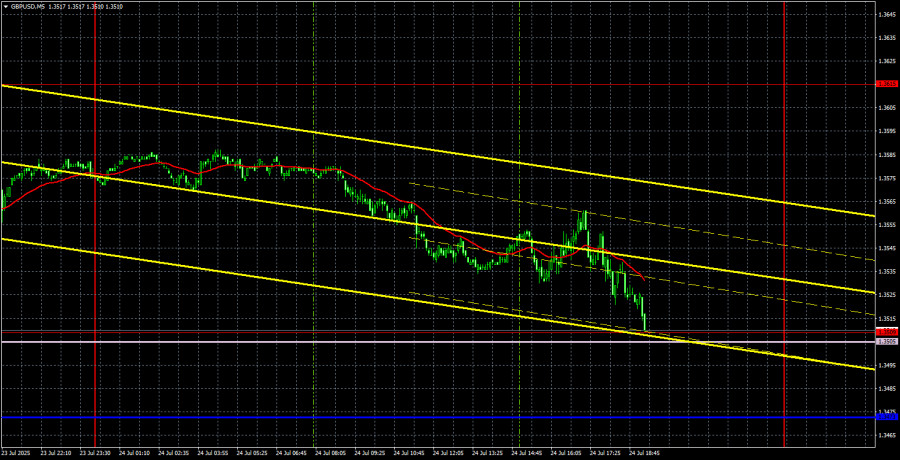
On Thursday, the GBP/USD currency pair traded lower, which can be considered a local correction. This movement will cease to be a correction only if the price consolidates below the Ichimoku indicator lines, which are currently positioned near the current price. However, the likelihood of a rebound from these lines or the 1.3509 level is significantly higher.
On Thursday, the UK released two business activity indices, both of which showed rather mediocre results. While the manufacturing sector index rose slightly above forecasts, the services sector index unexpectedly dropped by almost two points. It appears that this decline in the services index triggered the fall in the British currency.
In contrast, U.S. business activity indices showed completely opposite dynamics. The services sector rose to 55.2 points, while the manufacturing sector fell to 49.5. However, it's worth noting that the U.S. has its own more significant ISM indices, which the market usually pays closer attention to.
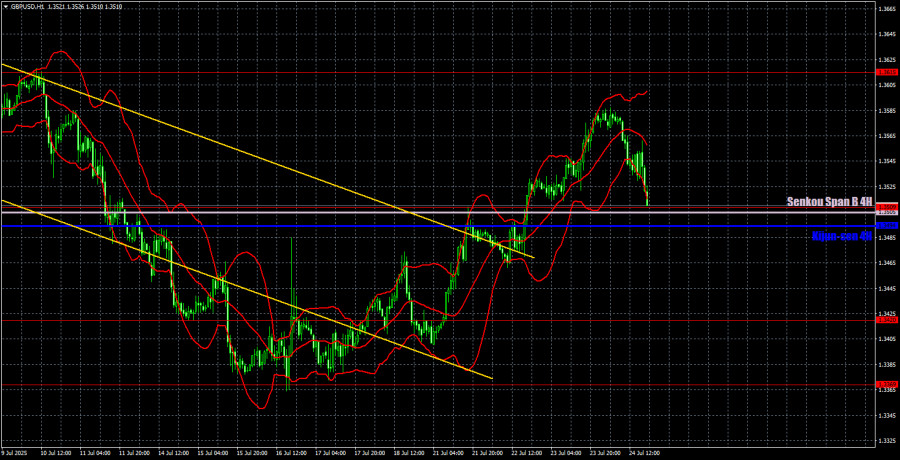
From a technical perspective, the pound also maintains an upward trend, which began to form after breaking out of the descending channel. As long as the price remains above the Senkou Span B and Kijun-sen lines, there is no reason to expect the uptrend to end.
In the 5-minute time frame, no trading signals were formed yesterday, as the price did not test any line or level throughout the day.
COT Report
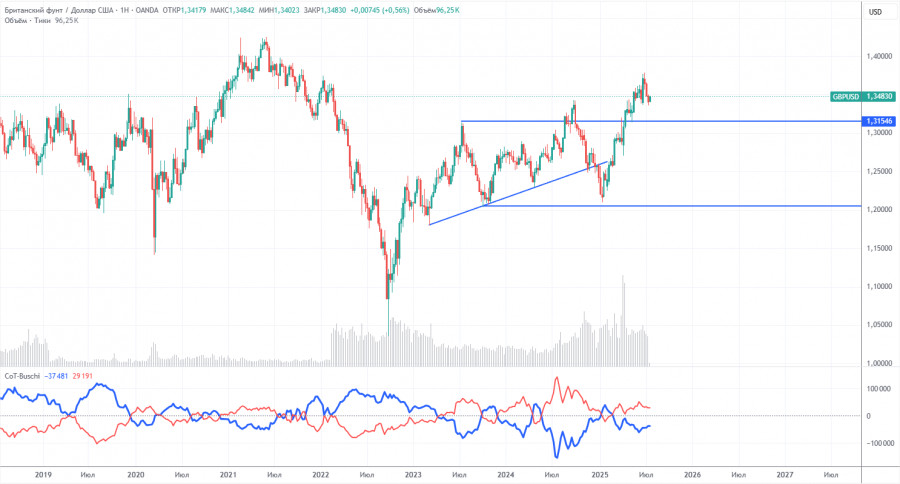
COT reports on the British pound show that over the past few years, the sentiment of commercial traders has changed frequently. The red and blue lines—representing the net positions of commercial and non-commercial traders—cross each other regularly and tend to hover near the zero mark. Currently, they are also located close together, which indicates a roughly equal number of buy and sell positions. However, over the past year and a half, the net position has been growing and in recent months has remained bullish.
The dollar continues to weaken due to Donald Trump's policies; therefore, in principle, market makers' demand for the pound sterling is not particularly significant at present. The trade war, in one form or another, is likely to persist for an extended period, and demand for the dollar is expected to continue declining. According to the latest report on the British pound, the "Non-commercial" group closed 7,000 BUY contracts and 3,000 SELL contracts. As a result, the net position of non-commercial traders declined by 4,000 contracts over the reporting week.
In 2025, the pound has risen sharply—but this is due to one key reason: Trump's policy. Once this factor is neutralized, the dollar may return to growth—but when that will happen, no one knows. The pace of growth in the net position for the pound is not particularly relevant at this time. What matters is that the dollar's net position is declining much faster.
GBP/USD 1-Hour Analysis
In the hourly time frame, the GBP/USD pair has started forming a new local uptrend, which is likely to become part of a broader, long-term upward trend. Donald Trump's policies remain unchanged, tariffs are still being imposed, and pressure on Jerome Powell continues. The market already had few reasons to buy the U.S. dollar—and those reasons aren't increasing.
For July 25, we highlight the following important levels: 1.3125, 1.3212, 1.3369, 1.3420, 1.3509, 1.3615, 1.3741–1.3763, 1.3833, 1.3886. The Senkou Span B line (1.3505) and the Kijun-sen line (1.3494) may also serve as signal sources. A Stop Loss level is recommended at breakeven once the price moves 20 pips in the correct direction. The Ichimoku indicator lines may shift during the day, so this should be considered when determining trading signals.
On Friday, the UK will release its retail sales report, which is expected to have a similar impact on trader sentiment as the business activity indices. In the U.S., a more important report on durable goods orders will be published. The market could react to macroeconomic data both in the morning and during the day.
Illustration Explanations:
- Support and resistance price levels – thick red lines where movement may end. They are not trading signal sources.
- Kijun-sen and Senkou Span B lines—These are strong Ichimoku indicator lines transferred to the hourly timeframe from the 4-hour one.
- Extremum levels – thin red lines where the price has previously rebounded. These act as trading signal sources.
- Yellow lines – trend lines, trend channels, and other technical patterns.
- COT Indicator 1 on the charts – the size of the net position for each category of traders.


