Analysis of Monday's Trades
1H Chart of EUR/USD
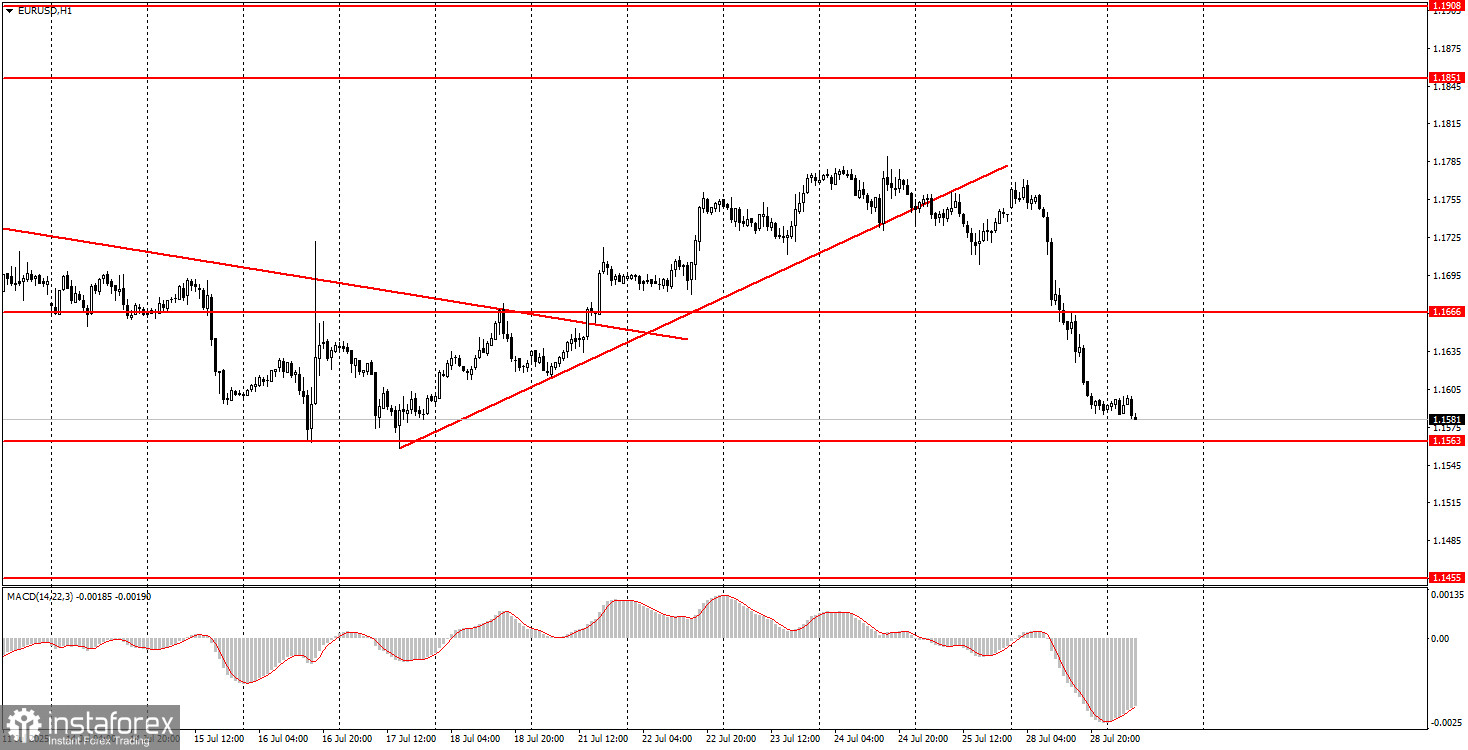
The EUR/USD currency pair plunged on Monday for quite understandable, logical, and consistent reasons. Essentially, the only event of the day was the announcement of a trade agreement between the EU and the U.S., made by President Donald Trump and European Commission President Ursula von der Leyen. It was precisely after the initial details of the deal became public that the euro plunged. There were at least two strong reasons for this.
First, since the dollar had weakened amid the escalation of the trade war, it should logically strengthen as the trade war de-escalates. Second, the deal benefits only one party, and that is not the European Union. The published terms of the agreement are so onerous for Brussels that Ursula von der Leyen was harshly criticized in Europe within just 15 minutes of signing this "fairytale deal". As a result, a new leg of the downward correction began on the daily time frame, which on the lower time frames appears as a new local downtrend. If the price settles below 1.1563, it will signal a continuation of the euro's decline.
5M Chart of EUR/USD
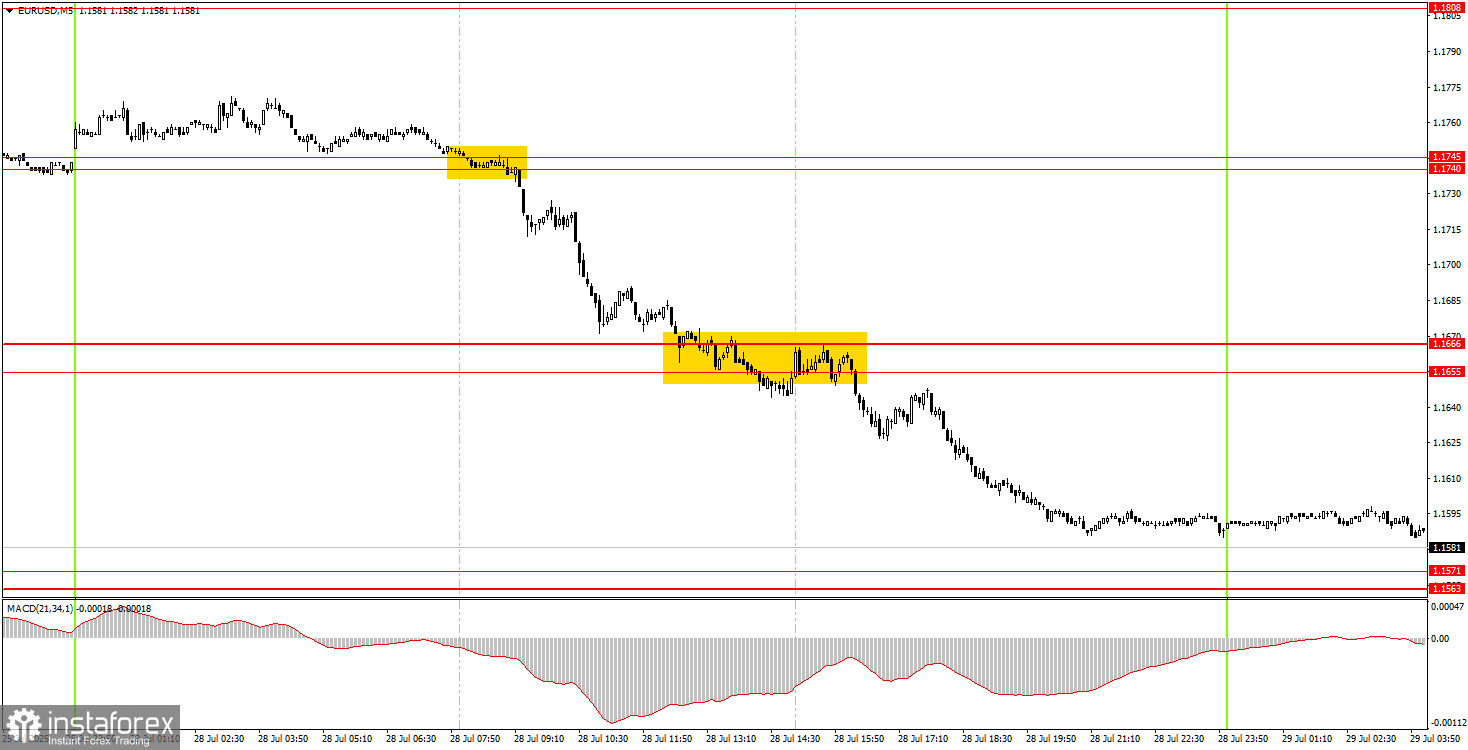
In the 5-minute timeframe, two excellent sell signals were formed on Monday, and the intraday movement was strong. Early in the European session, the price settled below the 1.1740–1.1745 area, and at the start of the U.S. session, below the 1.1655–1.1666 area. Thus, novice traders could have entered short on either signal and locked in profits by evening.
Trading Strategy for Tuesday:
On the hourly time frame, the EUR/USD pair resumed a corrective downward move, triggered by news of the EU–U.S. agreement. Since Trump's policies remain unchanged, and the topics of confrontation with Jerome Powell and the trade war are still relevant, we still do not see any medium-term drivers for sustained dollar appreciation. Therefore, in the short term, the dollar may continue rising, but in the long term, this is unlikely.
On Tuesday, the EUR/USD pair may extend its local bearish pullback, and we recommend novice traders closely monitor the 1.1563–1.1571 area. A bounce from this area would allow for long positions with a target of 1.1655–1.1666. If the price consolidates below this area, short positions may be considered again, targeting 1.1527 and 1.1474.
On the 5-minute chart, the following levels should be monitored: 1.1198–1.1218, 1.1267–1.1292, 1.1354–1.1363, 1.1413, 1.1455–1.1474, 1.1527, 1.1563–1.1571, 1.1655–1.1666, 1.1740–1.1745, 1.1808, 1.1851, 1.1908.
On Tuesday, the only notable macroeconomic release will be the U.S. JOLTs report, which is likely to trigger only a mild market reaction. However, the market may still digest Monday's trade deal and begin preparing for the upcoming FOMC meeting and key U.S. macro data.
Core Trading System Rules:
- Signal Strength: The shorter the time it takes for a signal to form (a rebound or breakout), the stronger the signal.
- False Signals: If two or more trades near a level result in false signals, subsequent signals from that level should be ignored.
- Flat Markets: In flat conditions, pairs may generate many false signals or none at all. It's better to stop trading at the first signs of a flat market.
- Trading Hours: Open trades between the start of the European session and the middle of the US session, then manually close all trades.
- MACD Signals: On the hourly timeframe, trade MACD signals only during periods of good volatility and a clear trend confirmed by trendlines or trend channels.
- Close Levels: If two levels are too close (5–20 pips apart), treat them as a support or resistance zone.
- Stop Loss: Set a Stop Loss to breakeven after the price moves 15 pips in the desired direction.
Key Chart Elements:
Support and Resistance Levels: These are target levels for opening or closing positions and can also serve as points for placing Take Profit orders.
Red Lines: Channels or trendlines indicating the current trend and the preferred direction for trading.
MACD Indicator (14,22,3): A histogram and signal line used as a supplementary source of trading signals.
Important Events and Reports: Found in the economic calendar, these can heavily influence price movements. Exercise caution or exit the market during their release to avoid sharp reversals.
Forex trading beginners should remember that not every trade will be profitable. Developing a clear strategy and practicing proper money management are essential for long-term trading success.