GBP/USD 5-Minute Analysis
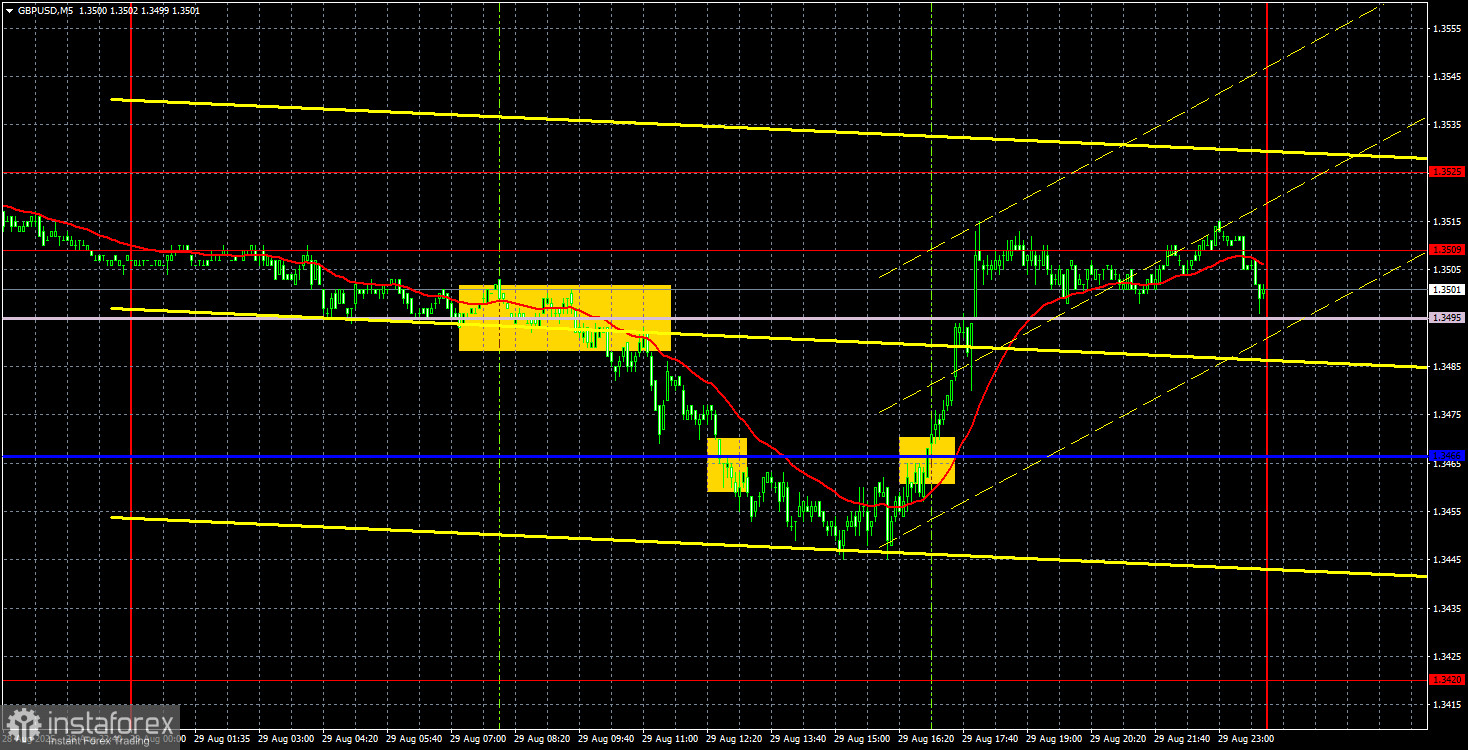
On Friday, the GBP/USD currency pair managed to trade both ways, fully taking advantage of the forming flat. In the first half of the day, the British pound declined for no apparent reason, as no important reports were scheduled in the UK. In the second half of the day, the market paid no attention to the "bland" PCE index and US personal income/spending data. Only the University of Michigan Consumer Sentiment Index, which came out worse than forecast and lower than the previous month, was really traded on. Overall, the British currency remains within the sideways channel of 1.3420–1.3525.
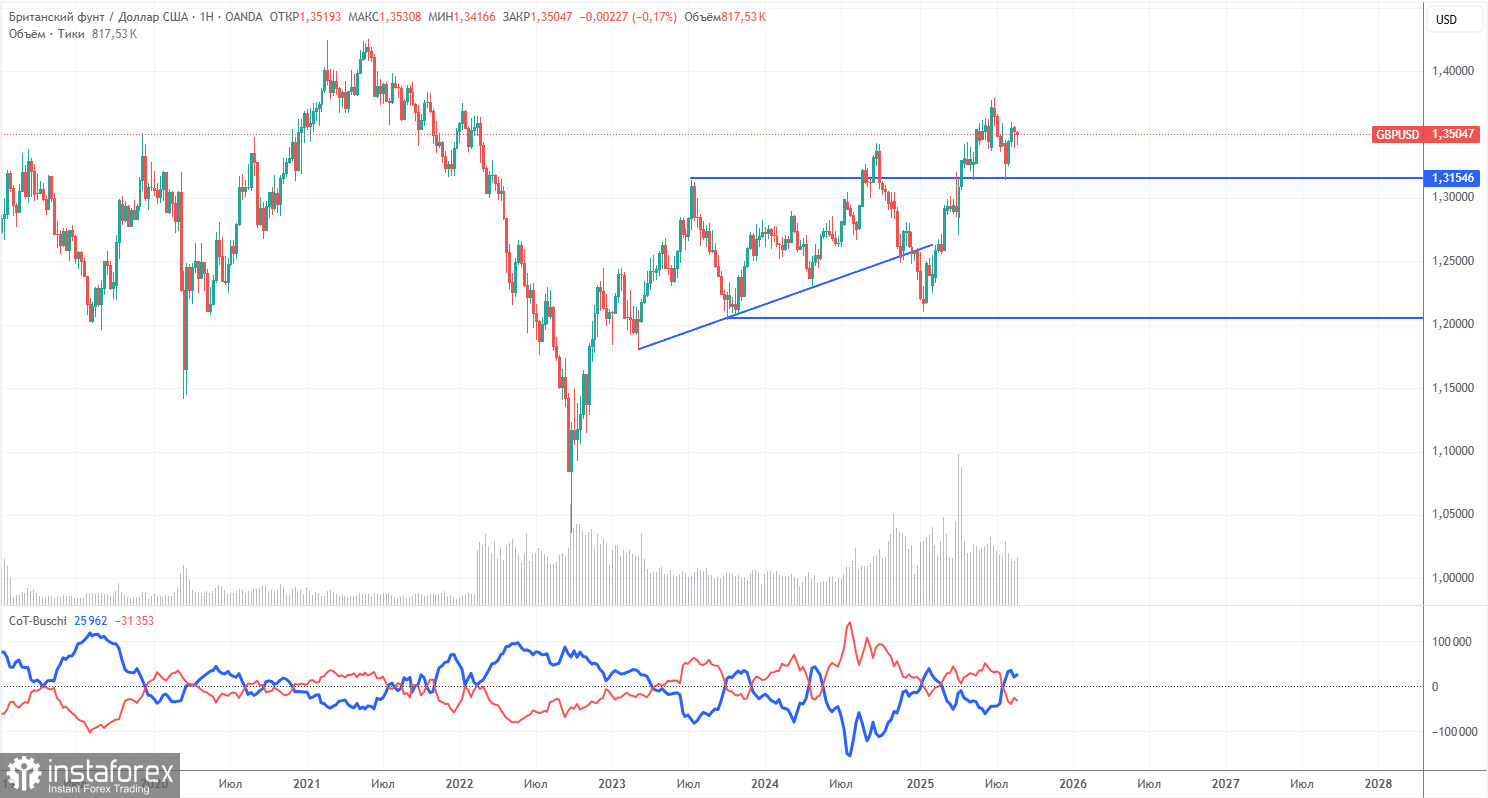
In the 4-hour timeframe, the flat is also clearly visible, so let's move to the daily chart. On this chart, it is clear that the uptrend remains intact and there are no signs of a downward trend beginning. Thus, we believe the British pound's growth will eventually resume. There will be plenty of important macroeconomic data from the US this week, so the current flat is very likely to end. The Nonfarm Payrolls report will partly answer the question of whether to expect Federal Reserve monetary policy easing in September. Also, don't forget about Donald Trump, who might "fire" another Fed official or add a couple of new trade tariffs. The market cannot ignore such news forever.
On the 5-minute timeframe, there were numerous trading signals on Friday. As we mentioned regarding the 1.3466–1.3525 area, it features two Ichimoku indicator lines and two levels running through it. As soon as one signal forms, the price immediately finds itself by another line or level, so it's pointless to open trades under such conditions. We believe the best approach right now is to wait for the flat to end.
COT Report
COT reports for the British pound indicate that over recent years, the sentiment of commercial traders has shifted constantly. The red and blue lines, reflecting net positions of commercial and non-commercial traders, frequently cross and usually close to zero. Currently, they're almost level, indicating a nearly equal number of buy and sell positions.
The dollar continues to weaken due to Trump's policy, so market makers' demand for sterling is not particularly important right now. The trade war is likely to persist in some form for an extended period. The Federal Reserve will be forced to cut rates at some point in the coming year. Demand for the dollar will decline anyway. According to the latest report on the pound, the "Non-commercial" group closed 5,300 BUY contracts and opened 800 SELL contracts. Thus, the net position of non-commercial traders shrank by 6,100 contracts over the reporting week.
In 2025, the pound strengthened greatly, but this was for one reason: Trump's policy. As soon as this is neutralized, the dollar could resume rising—but no one knows when that will happen. It doesn't matter how fast the net position of the pound rises or falls. For the dollar, it continues to decline, usually at a faster pace.
GBP/USD 1-Hour Analysis
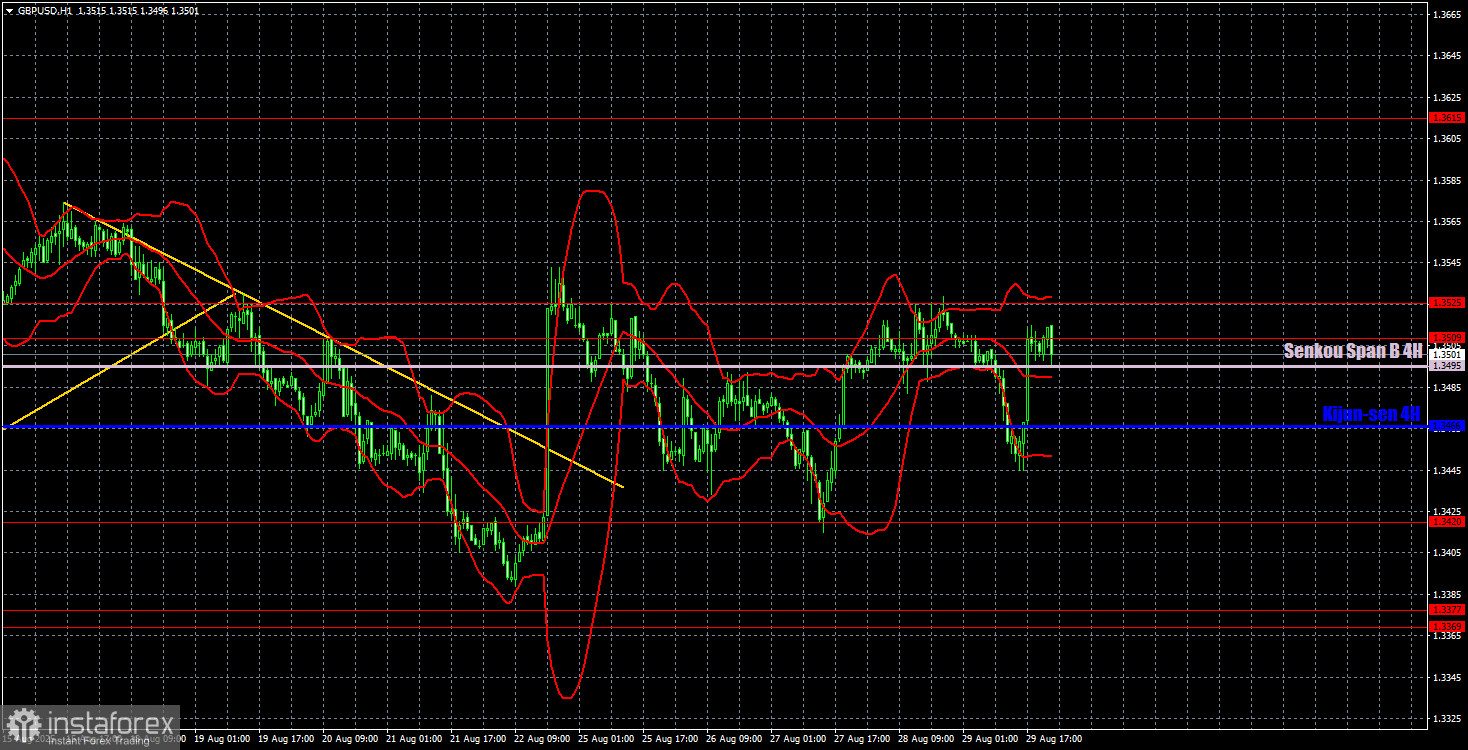
On the hourly timeframe, the GBP/USD pair is poised to form a new uptrend but is currently confined to a sideways channel between 1.3420 and 1.3525. The pair has corrected enough in recent weeks to resume the global uptrend that began back in January. The fundamental and macroeconomic background hasn't changed, so there is still no reason to expect the dollar to strengthen.
For September 1, we highlight the following important levels: 1.3125, 1.3212, 1.3369–1.3377, 1.3420, 1.3509–1.3525, 1.3615, 1.3681, 1.3763, 1.3833, 1.3886. The Senkou Span B (1.3495) and Kijun-sen (1.3466) lines can also serve as signal sources. The Stop Loss level is recommended to be set at breakeven once the price moves 20 pips in your favor. The Ichimoku indicator lines may fluctuate throughout the day, which should be taken into account when seeking trading signals.
On Monday, there are no important events scheduled in either the UK or the US. However, later in the week, the US macro release calendar will be extensive. So, the week will certainly not be boring.
Trading Recommendations
We believe that upward movement could resume on Monday, but the pound still faces resistance in the 1.3509–1.3525 area. We are awaiting a breakout of this area to consider long positions targeting 1.3615.
Illustration Explanations:
- Support and resistance price levels – thick red lines where movement may end. They are not trading signal sources.
- Kijun-sen and Senkou Span B lines—These are strong Ichimoku indicator lines transferred to the hourly timeframe from the 4-hour one.
- Extremum levels – thin red lines where the price has previously rebounded. These act as trading signal sources.
- Yellow lines – trend lines, trend channels, and other technical patterns.
- Indicator 1 on the COT charts – the size of the net position for each category of traders.