Trade Breakdown for Tuesday:
1H Chart of the EUR/USD Pair
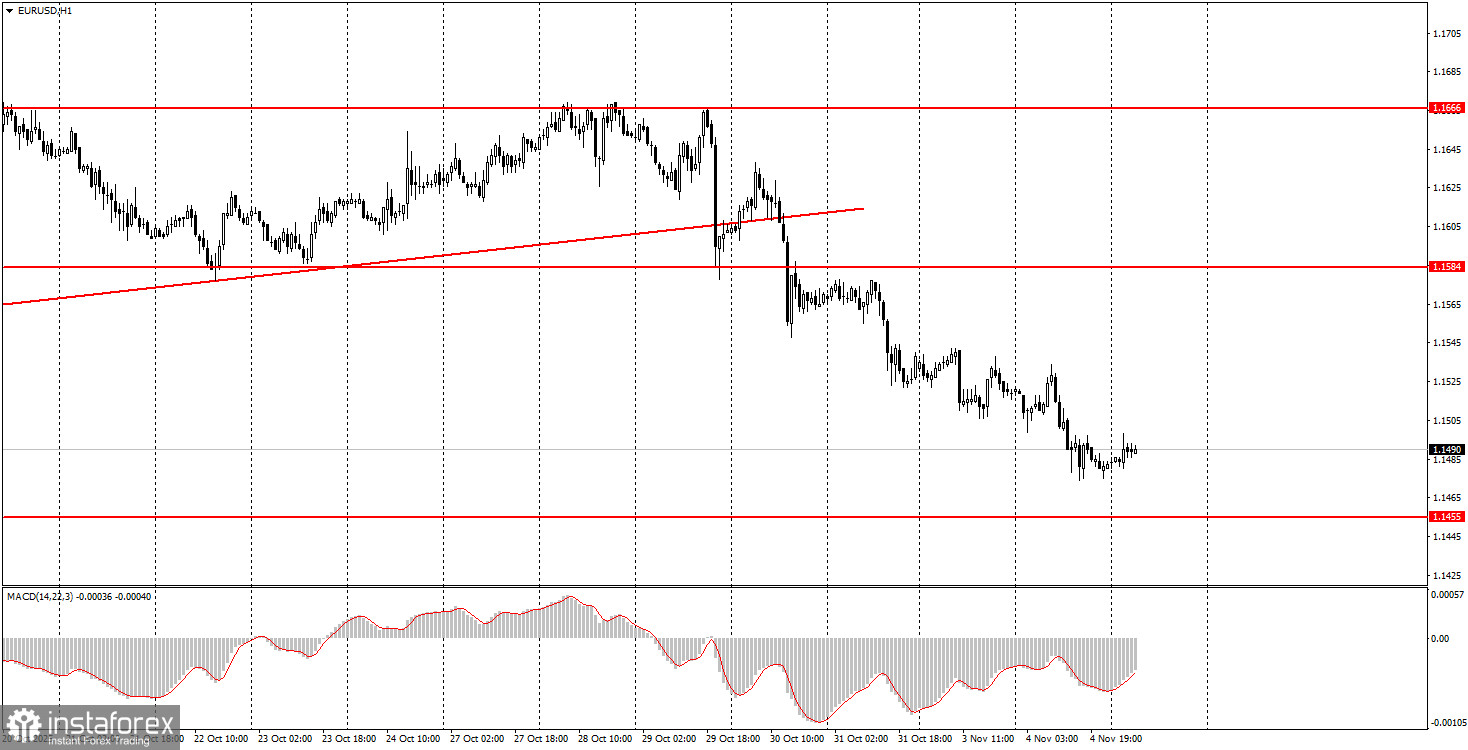
The EUR/USD currency pair continued to slide downward on Tuesday without any compelling reasons. During the past day, the only significant event was the speech by Christine Lagarde, the President of the European Central Bank, but Lagarde did not touch upon the topic of monetary policy or the economy. Therefore, this event could not have triggered a new fall of the euro. Nevertheless, we have been repeating the same thing for more than a month: the current downward movement is based solely on technical factors. The fundamental and macroeconomic background remains unfavorable for the U.S. dollar. The daily timeframe is flat, with the decline ongoing for more than a month. The price simply moves from the upper to the lower line of the sideways channel. However, for trading on lower timeframes, the overall trend is not particularly significant. Just yesterday, two decent trading signals were generated that could have been executed. It doesn't matter what trend is observed on the higher timeframes.
5M Chart of the EUR/USD Pair
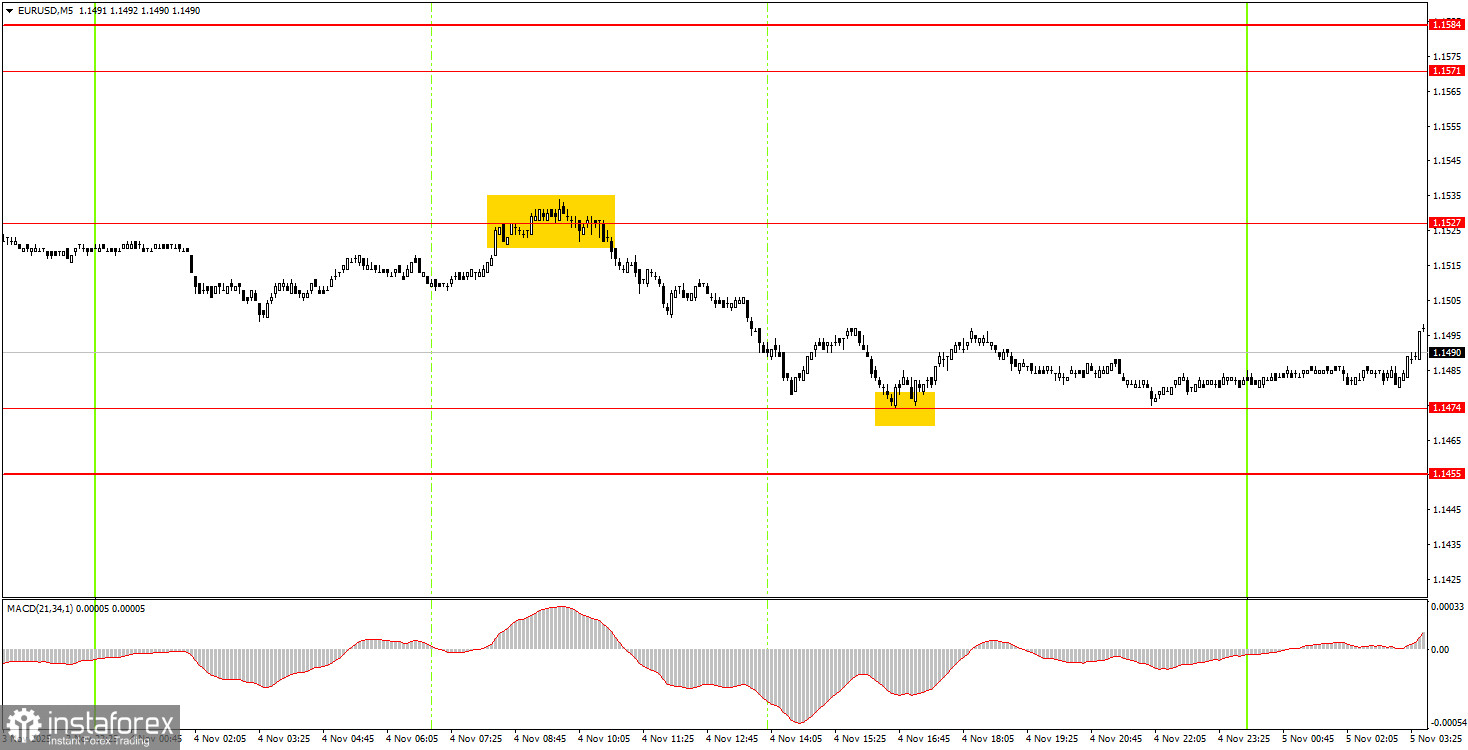
On the 5-minute timeframe, two trading signals were generated on Tuesday that novice traders could easily have executed. During the European trading session, the price bounced from 1.1527, and during the American session, it reacted at 1.1474 before bouncing from there. Thus, short positions could be opened initially, followed by long positions. Both trades were closed in profit.
How to Trade on Wednesday:
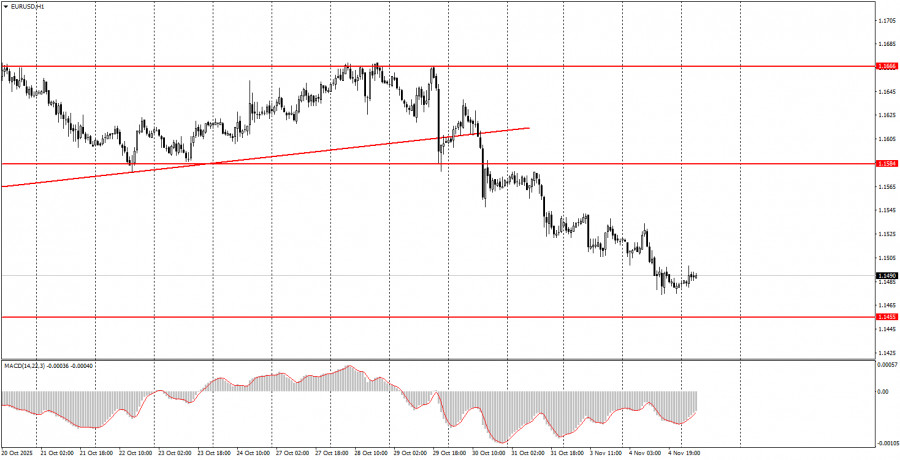
On the hourly timeframe, the EUR/USD pair continues its new downward trend. The ascending trend line has been breached, and the overall fundamental and macroeconomic background remains unfavorable for the U.S. dollar. Thus, based solely on technical grounds, the euro may continue its decline — the flat on the daily timeframe remains relevant. However, we expect it to end and for the upward trend of 2025 to resume.
On Wednesday, novice traders can trade in the area of 1.1455-1.1474. A buy signal was formed around this level last night, so novice traders can act on it. A firm breach below the 1.1455-1.1474 area will allow opening short positions with a target at 1.1413.
On the 5-minute timeframe, consider the levels: 1.1354-1.1363, 1.1413, 1.1455-1.1474, 1.1527, 1.1571-1.1584, 1.1655-1.1666, 1.1745-1.1754, 1.1808, 1.1851, 1.1908, 1.1970-1.1988. On Wednesday, only secondary service sector activity indices will be published in the Eurozone in their second assessment. In the U.S., far more significant reports on ADP and ISM are expected. The first report is the only one currently available to judge the U.S. labor market. The second is an equally important business activity index.
Main Rules of the Trading System:
- The strength of the signal is assessed based on the time it took to form the signal (bounce or breach of a level). The shorter the time, the stronger the signal.
- If two or more trades have been opened around a certain level on false signals, all subsequent signals from that level should be ignored.
- In a flat market, any pair can generate a multitude of false signals or may not form any at all. In any case, at the first signs of a flat, it's better to stop trading.
- Trading deals are opened during the time period between the beginning of the European session and the middle of the American session, after which all deals should be closed manually.
- On the hourly timeframe, it is advisable to trade on signals from the MACD indicator only when there is good volatility and a trend that is confirmed by a trend line or trend channel.
- If two levels are too close to each other (between 5 and 20 pips), they should be treated as a support or resistance area.
- After moving 15 pips in the right direction, a Stop Loss should be set to breakeven.
What is on the Charts:
- Support and resistance price levels are targets for opening buy or sell positions. Take Profit levels can be placed around them.
- Red lines indicate channels or trend lines that reflect the current trend and indicate the preferred direction for trading.
- The MACD indicator (14,22,3) — histogram and signal line — is an auxiliary indicator that can also be used as a source of signals.
Important speeches and reports (always available in the news calendar) can significantly impact the movement of the currency pair. Therefore, during their release, trading should be done with maximum caution, or traders should exit the market to avoid a sharp reversal in price against the preceding movement.
Beginners trading in the Forex market should remember that not every trade can be profitable. Developing a clear strategy and money management are keys to success in trading over the long term.