Trade Analysis for Thursday:
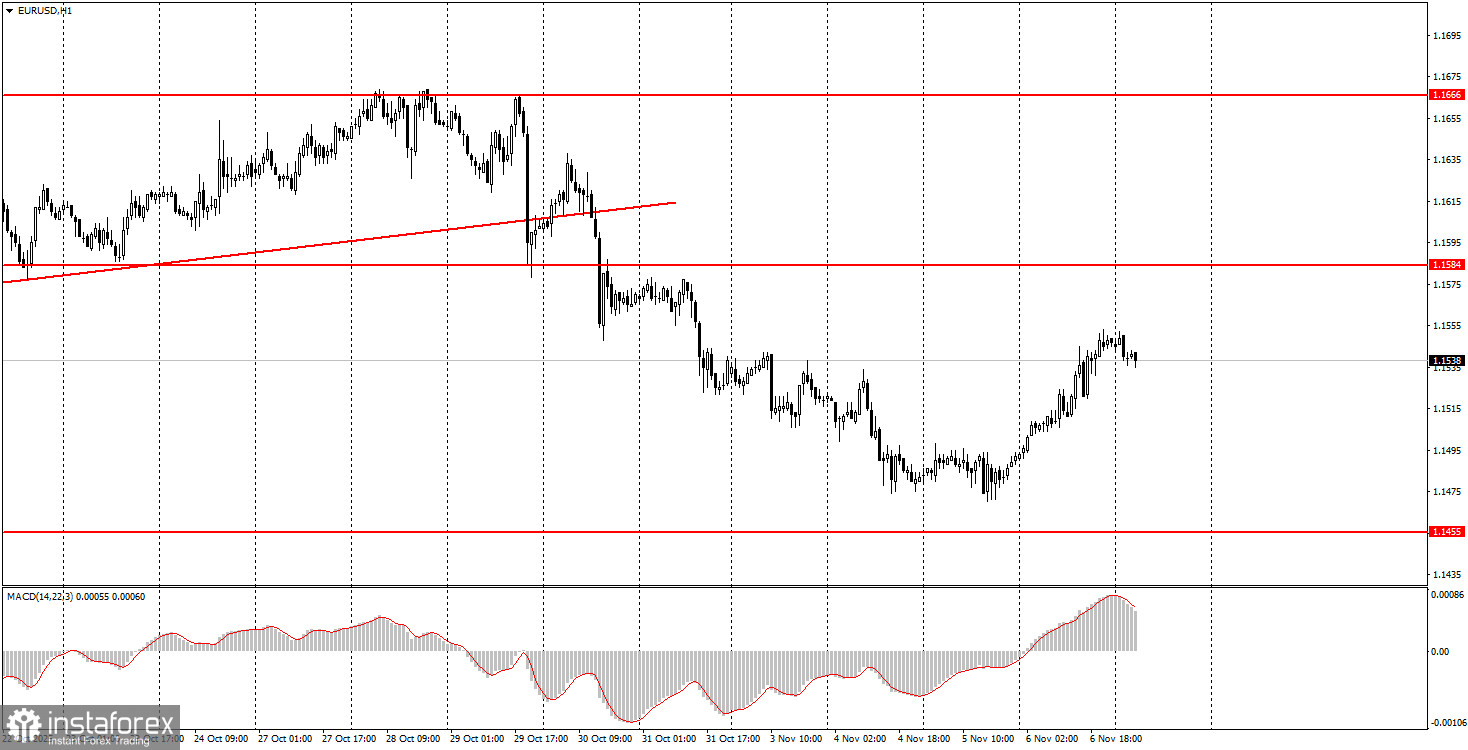
1H Chart of EUR/USD.
The EUR/USD currency pair surprised many on Thursday. Over the past five weeks, the European currency has been in a continuous decline, but yesterday it started to rise unexpectedly. Notably, on Monday and Wednesday, the market ignored all macroeconomic factors, and yesterday it disregarded both macroeconomic and fundamental aspects. As we mentioned, there is currently no correlation between the pair's movements and the news. Yesterday, reports on German industrial production and European retail sales were published, both of which came in weaker than expected. This had absolutely no impact on market sentiment, as the euro rose throughout the day. In the UK, the Bank of England decided to maintain the key rate, but the voting results were more "dovish" than anticipated. Previously, such results regularly led to a decline in the pound. Yet yesterday, we observed growth. Therefore, both currency pairs continue to move on "bare" technicals.
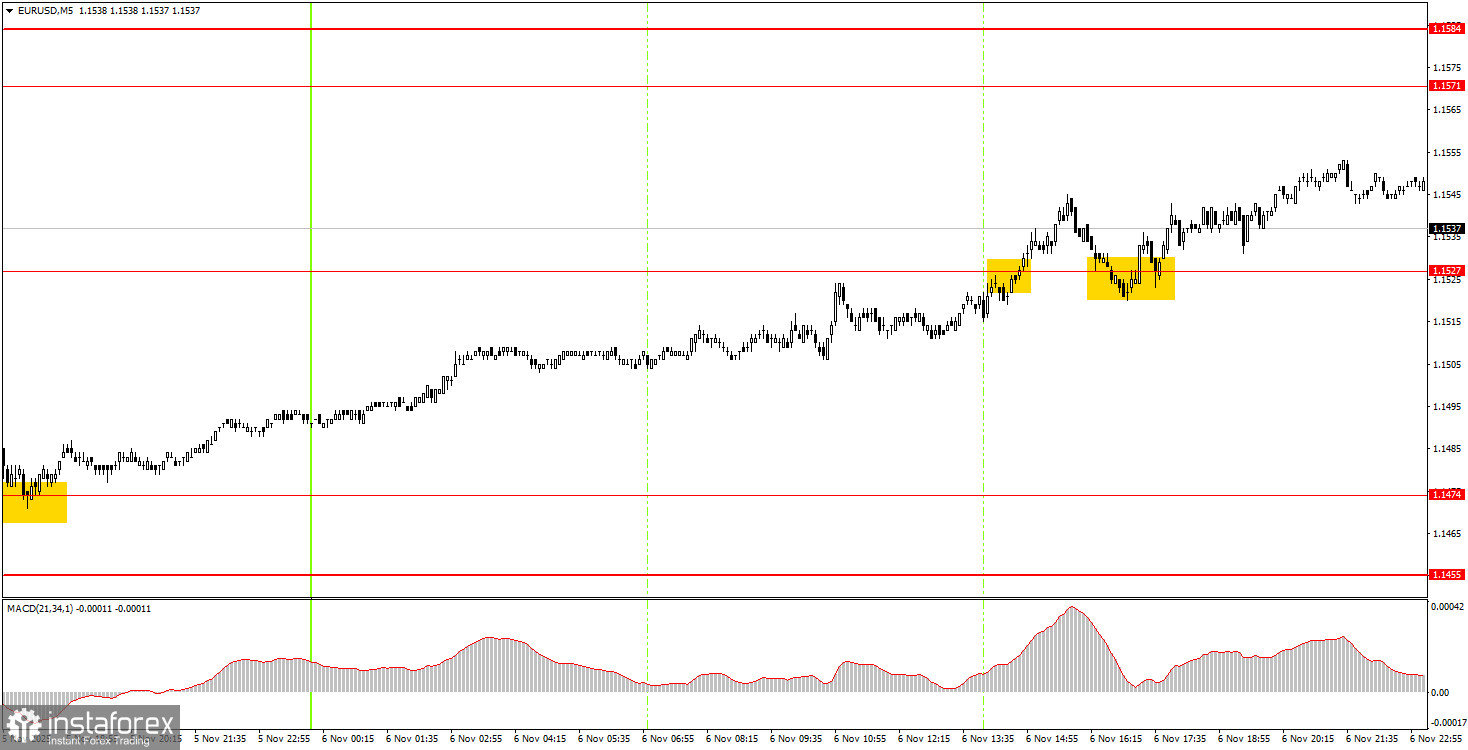
5M Chart of EUR/USD
On the 5-minute timeframe, two trade signals were formed during Thursday; however, a buy signal was generated on Wednesday evening around the level of 1.1474, from which the upward movement began. Thus, novice traders could have opened long positions on Wednesday and merely maintained them on Thursday, as no sell signals were generated during the day. By the end of the day, the price had surpassed the level of 1.1527, allowing traders to remain in long positions even on Friday, placing a Stop Loss in profit.
How to Trade on Friday:
On the hourly timeframe, the EUR/USD pair continues its new downward trend. The ascending trendline has been breached, and the overall fundamental and macroeconomic backdrop remains unfavorable for the U.S. dollar. Therefore, only based on technical grounds can the European currency continue to decline—the flat on the daily timeframe remains relevant. However, we expect its completion and the resumption of the upward trend in 2025.
On Friday, novice traders can anticipate continued growth, targeting 1.1571-1.1584, as three buy signals have been generated over the last three days. If the pair establishes itself below the level of 1.1527 today, short positions will become relevant with a target of 1.1474.
On the 5-minute timeframe, consider the following levels: 1.1354-1.1363, 1.1413, 1.1455-1.1474, 1.1527, 1.1571-1.1584, 1.1655-1.1666, 1.1745-1.1754, 1.1808, 1.1851, 1.1908, 1.1970-1.1988. No important events or reports are scheduled for Friday in the EU, while in the U.S., only the University of Michigan consumer sentiment index will be released. In any case, this week and over the past month, the market has been ignoring fundamentals and macroeconomics.
Key Principles of My Trading System:
- The strength of the signal is considered based on the time taken to form the signal (bounce or breach of a level). The less time taken, the stronger the signal.
- If two or more trades have been opened around a certain level based on false signals, all subsequent signals from that level should be ignored.
- In a flat market, any pair can create numerous false signals or may not form them at all. In any case, it's best to stop trading at the first signs of a flat.
- Trading deals are opened during the period between the start of the European session and the middle of the American session, after which all deals should be closed manually.
- On the hourly timeframe, it is preferable to trade based on signals from the MACD indicator only when there is good volatility and a trend that is confirmed by a trend line or trend channel.
- If two levels are too close to each other (between 5 and 20 pips), they should be treated as an area of support or resistance.
- After a 15-pip move in the right direction, a Stop Loss should be set to breakeven.
What the Charts Show:
- Support and resistance price levels are targets for opening buy or sell positions. Take Profit levels can be placed around them.
- Red lines indicate trend channels or trend lines, reflecting the current trend and indicating the preferred trading direction.
- The MACD indicator (14,22,3) — histogram and signal line — is a supplementary indicator that can also be used as a source of signals.
Important announcements and reports (always available in the news calendar) can significantly impact the movement of the currency pair. Therefore, during their release, it is recommended to trade with maximum caution or to exit the market to avoid sharp reversals against the preceding movement.
Beginners trading on the Forex market should remember that not every trade can be profitable. Developing a clear strategy and money management is key to long-term success in trading.