Analysis of Wednesday's Trades
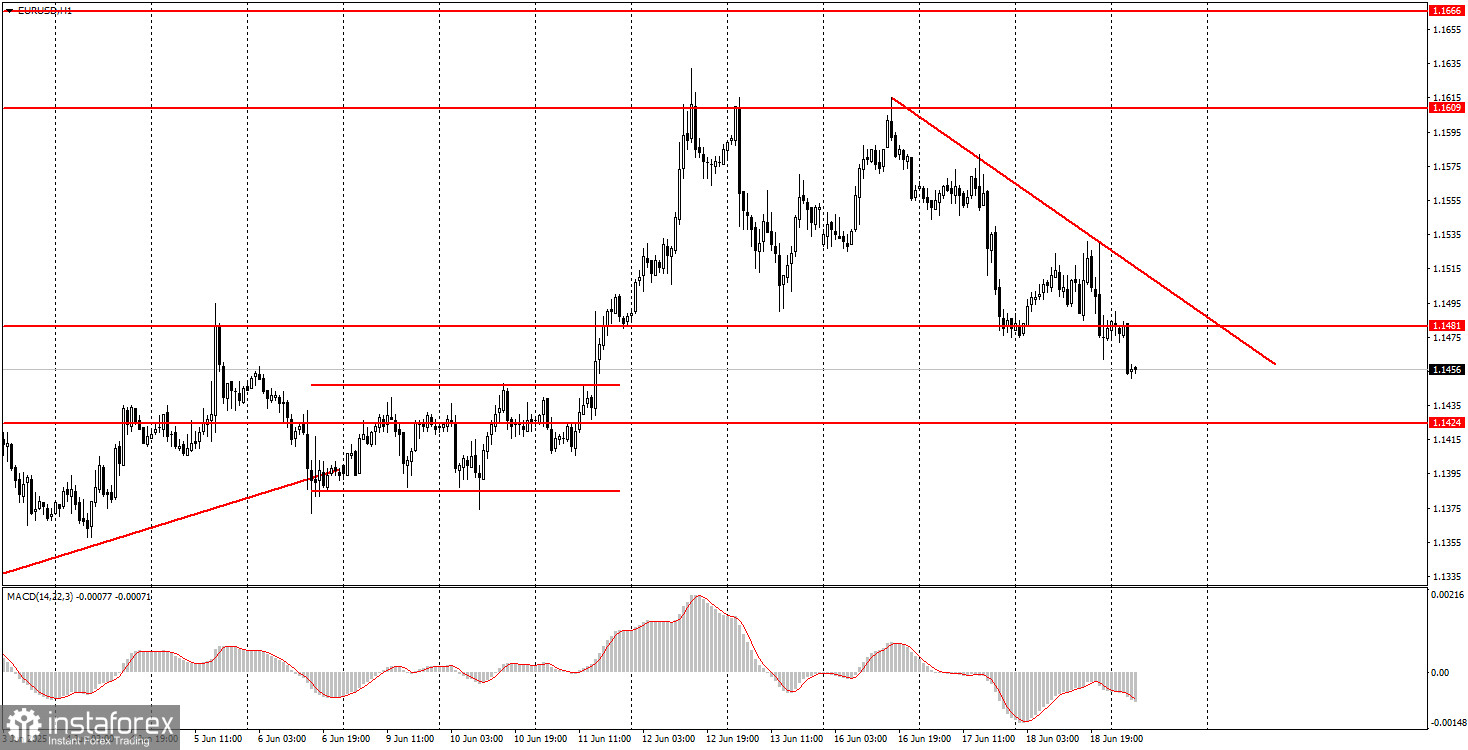
1H Chart of EUR/USD
On Wednesday, the EUR/USD currency pair generally continued trading downward. However, the U.S. dollar only resumed its rise after the results of the Federal Reserve meeting were announced. Currently, the dollar has strengthened only slightly, and the outcome of the Fed meeting can be described as nothing but "bland." No impactful decisions were made regarding monetary policy. The key rate remained unchanged, Jerome Powell once again stated the intention to "wait and see," and the dot plot showed only minimal changes in the expected rate path for the next two years. Therefore, the dollar has been rising on very ambiguous factors for the second day in a row. Let's recall that the dollar failed to rise even when the European Central Bank cut rates at every meeting. The dollar failed to rise even when the Fed kept rates unchanged at every meeting in 2025. Thus, we still do not believe the U.S. currency has completed what has been a dismal period for it.
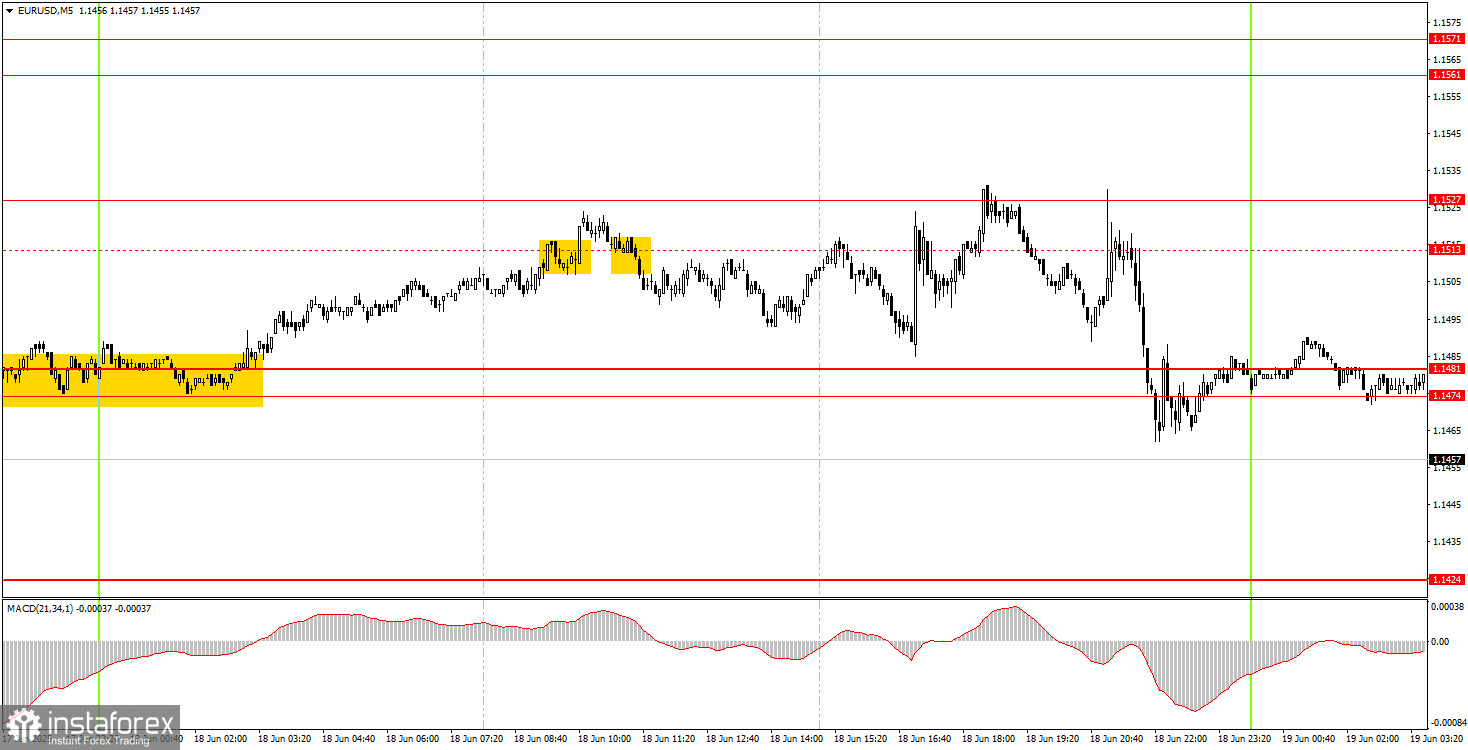
5M Chart of EUR/USD
On the 5-minute timeframe, Wednesday's movements were very erratic. To begin with, before the Fed's announcement, the pair was stuck in a total flat range. As a result, most of the signals that formed were false. Around the 1.1513 level, the first two signals were fake, so all subsequent signals should have been ignored. By the end of the day, this level was revised to 1.1527.
Trading Strategy for Thursday:
On the hourly timeframe, the EUR/USD pair continues its upward trend, which began under Donald Trump and likely won't end until after the next president takes office. For now, the mere fact that Trump is the U.S. president is enough to keep downward pressure on the dollar. Even the escalating conflict between Iran and Israel hasn't significantly affected the overall standing of the U.S. currency. The American leader continues issuing threats, making ultimatums, introducing or raising tariffs, and preparing to enter a war with Iran. As a result, even if the market isn't selling the dollar daily, it's certainly not eager to buy it for the mid-term, either.
On Thursday, the EUR/USD pair may continue to decline, although the market has not yet finished pricing in yesterday's Fed meeting results. A trendline has formed, but we do not rule out that the dollar could already return to its previous lows—near three-year minimums—as early as today.
On the 5-minute timeframe, the relevant levels for Thursday are: 1.1132–1.1140, 1.1198–1.1218, 1.1267–1.1292, 1.1354–1.1363, 1.1413–1.1424, 1.1474–1.1481, 1.1527, 1.1561–1.1571, 1.1609, 1.1666, 1.1704, 1.1802. On Thursday, the only notable events on the agenda are two speeches by ECB President Christine Lagarde. We believe these events will not significantly impact the market, and traders will likely continue reacting to the Fed and Bank of England meeting outcomes.
Core Trading System Rules:
- Signal Strength: The shorter the time it takes for a signal to form (a rebound or breakout), the stronger the signal.
- False Signals: If two or more trades near a level result in false signals, subsequent signals from that level should be ignored.
- Flat Markets: In flat conditions, pairs may generate many false signals or none at all. It's better to stop trading at the first signs of a flat market.
- Trading Hours: Open trades between the start of the European session and the middle of the US session, then manually close all trades.
- MACD Signals: On the hourly timeframe, trade MACD signals only during periods of good volatility and a clear trend confirmed by trendlines or trend channels.
- Close Levels: If two levels are too close (5–20 pips apart), treat them as a support or resistance zone.
- Stop Loss: Set a Stop Loss to breakeven after the price moves 15 pips in the desired direction.
Key Chart Elements:
Support and Resistance Levels: These are target levels for opening or closing positions and can also serve as points for placing Take Profit orders.
Red Lines: Channels or trendlines indicating the current trend and the preferred direction for trading.
MACD Indicator (14,22,3): A histogram and signal line used as a supplementary source of trading signals.
Important Events and Reports: Found in the economic calendar, these can heavily influence price movements. Exercise caution or exit the market during their release to avoid sharp reversals.
Forex trading beginners should remember that not every trade will be profitable. Developing a clear strategy and practicing proper money management are essential for long-term trading success.