Trade Analysis for Wednesday:
1H Chart of the GBP/USD Pair
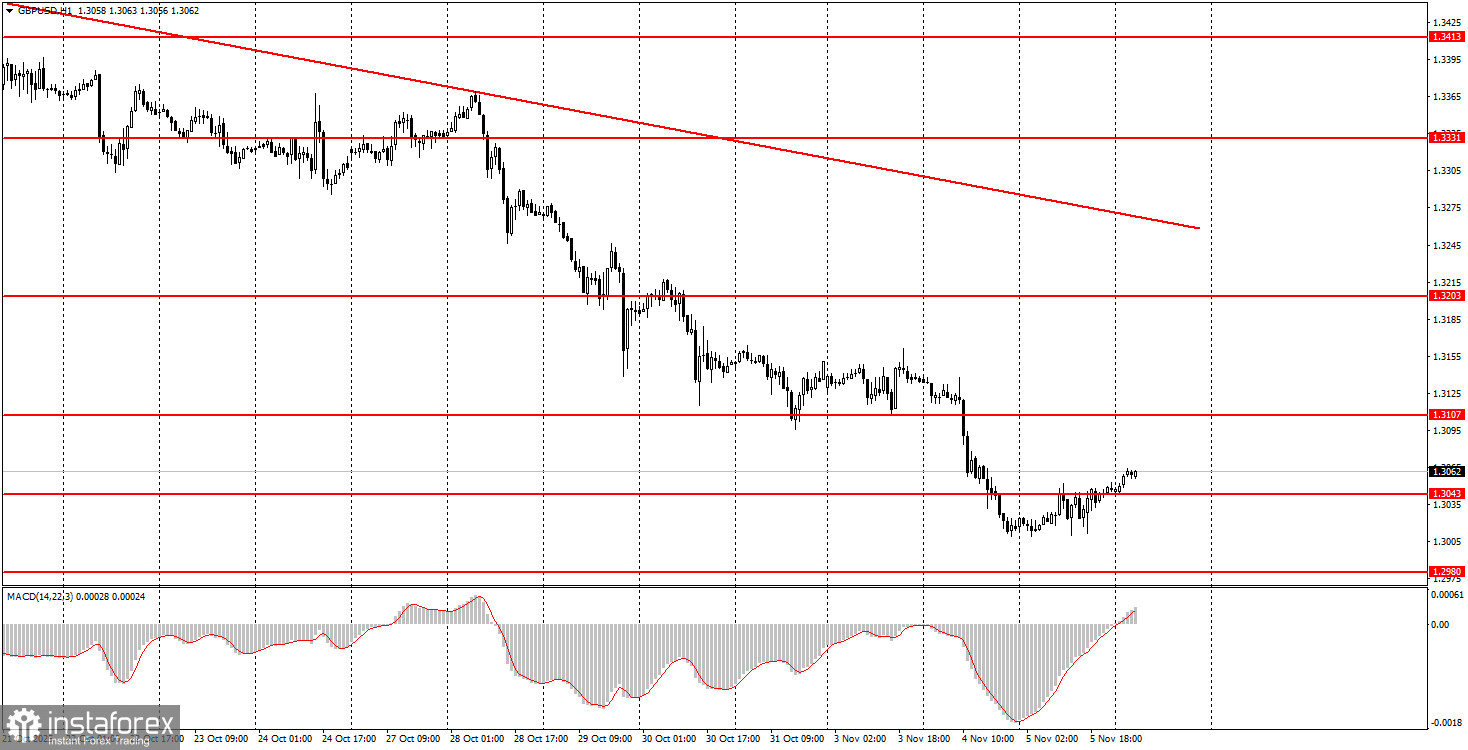
The GBP/USD currency pair remained stagnant on Wednesday. If the U.S. dollar had continued to rise yesterday, it would not have come as a surprise, as there were solid reasons for the dollar to rise—namely, the ISM services activity index and the ADP report both showed higher values than anticipated. However, there is still very little logic in the current market movements. More precisely, the dependency of movements on macroeconomic and fundamental factors is minimal. The GBP/USD pair continues to trade based solely on technical factors. The situation we observe is as follows: on Monday and Tuesday, the dollar had no reason to rise, yet it did. On Wednesday, there were reasons for growth, but it fell instead. Today, the Bank of England will hold a meeting, and the results may be surprising, potentially resulting in almost any reaction from the market. Thus, volatility could be high today.
5M Chart of the GBP/USD Pair
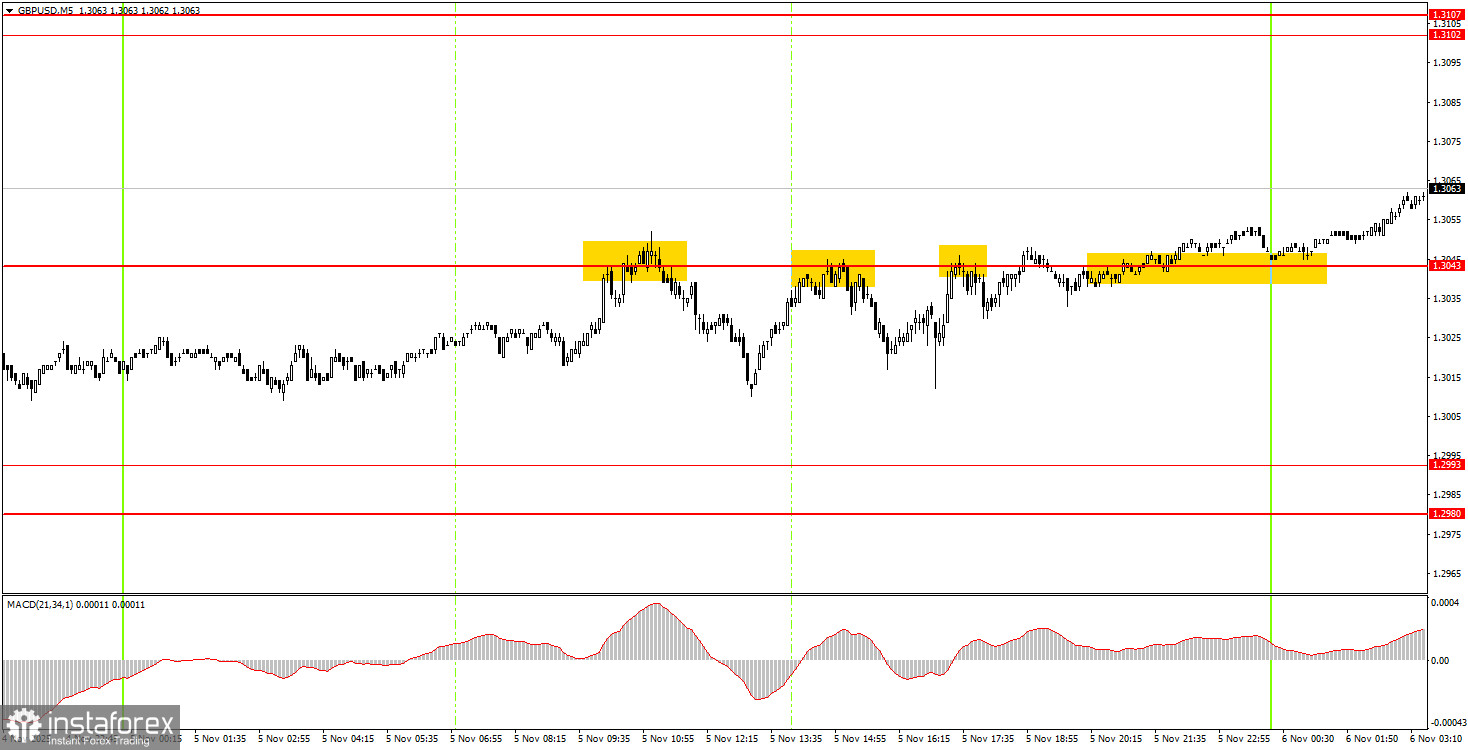
On the 5-minute timeframe, three trading signals were formed during the day on Wednesday, all focused on selling near the level of 1.3043. The price bounced off this level three times, each time moving down approximately 20 pips. As a result, novice traders could have opened short positions based on these signals, but it's unlikely they made a profit. However, since the price consistently moved 20 pips in the right direction, there wouldn't have been any loss on these trades. Eventually, during the night, the price broke through the 1.3043 level, suggesting the possibility of opening long positions.
How to Trade on Thursday:
On the hourly timeframe, the GBP/USD pair is continuing to form a new downward trend. Currently, the British pound is declining for virtually any reason. As we have already mentioned, there are no grounds for sustained dollar growth; therefore, in the medium term, we only anticipate upward movement. However, the flat factor in the long term continues to pull the pair down, which represents an entirely illogical development.
On Thursday, novice traders may hold long positions from last night's buying signal or wait for a new buy signal around 1.3043. The target is 1.3102. If the pair consolidates below 1.3043, short positions can be considered, targeting 1.2993.
On the 5-minute timeframe, levels to consider are 1.2913, 1.2980–1.2993, 1.3043, 1.3102–1.3107, 1.3203–1.3211, 1.3259, 1.3329–1.3331, 1.3413–1.3421, 1.3466–1.3475, 1.3529–1.3543, and 1.3574–1.3590. On Thursday, the UK is scheduled to release reports on retail sales and industrial production. However, at this time, the market is not paying much attention to macroeconomic data.
Key Principles of My Trading System:
- The strength of the signal is considered based on the time taken to form the signal (bounce or breach of a level). The less time taken, the stronger the signal.
- If two or more trades have been opened around a certain level based on false signals, all subsequent signals from that level should be ignored.
- In a flat market, any pair can create numerous false signals or may not form them at all. In any case, it's best to stop trading at the first signs of a flat.
- Trading deals are opened during the period between the start of the European session and the middle of the American session, after which all deals should be closed manually.
- On the hourly timeframe, it is preferable to trade based on signals from the MACD indicator only when there is good volatility and a trend that is confirmed by a trend line or trend channel.
- If two levels are too close to each other (between 5 and 20 pips), they should be treated as an area of support or resistance.
- After a 20-pip move in the right direction, a Stop Loss should be set to breakeven.
What the Charts Show:
- Support and resistance price levels are targets for opening buy or sell positions. Take Profit levels can be placed around them.
- Red lines indicate trend channels or trend lines, reflecting the current trend and indicating the preferred trading direction.
- The MACD indicator (14,22,3) — histogram and signal line — is a supplementary indicator that can also be used as a source of signals.
Important announcements and reports (always available in the news calendar) can significantly impact the movement of the currency pair. Therefore, during their release, it is recommended to trade with maximum caution or to exit the market to avoid sharp reversals against the preceding movement.
Beginners trading on the Forex market should remember that not every trade can be profitable. Developing a clear strategy and money management is key to long-term success in trading.