GBP/USD
Analysis:
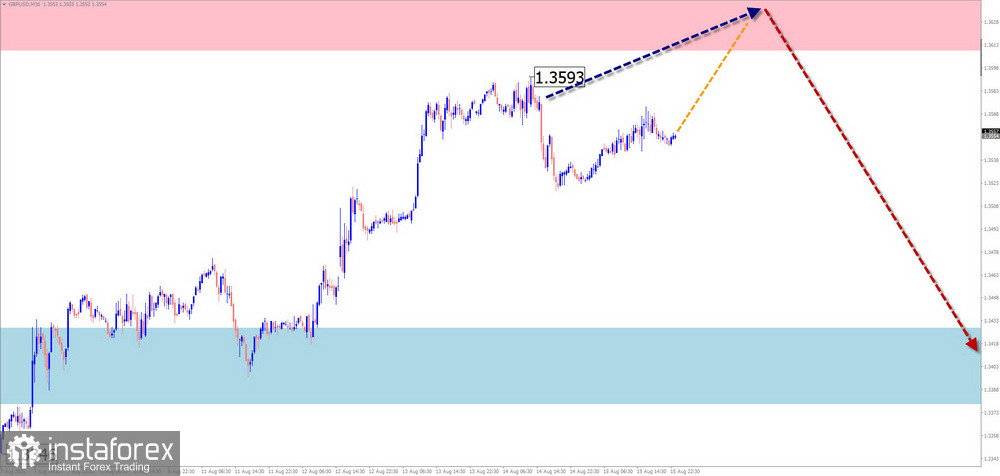
Since the beginning of the year, the pound's movement has been guided by a bullish trend. On the short-term scale, the price has been declining throughout the past month. It should be noted that on the weekly chart, this wave corrects the broader uptrend. Since August 1, quotes have been forming a counter-move that remains within the current correction.
Forecast:
During the coming week, the upward phase is expected to end completely, with a reversal and the start of a bearish trend. A shift in direction may trigger a spike in volatility and a short-term breakout above the upper resistance zone. The calculated support defines the lower boundary of the expected weekly move.
Potential Reversal Zones
- Resistance: 1.3610/1.3660
- Support: 1.3430/1.3380
Recommendations:
- Buy: Possible intraday with fractional volumes, limited by calculated resistance.
- Sell: Could yield intraday profit with reduced volumes, but trades should be opened only upon confirmation from your trading system (TS).
AUD/USD
Analysis:
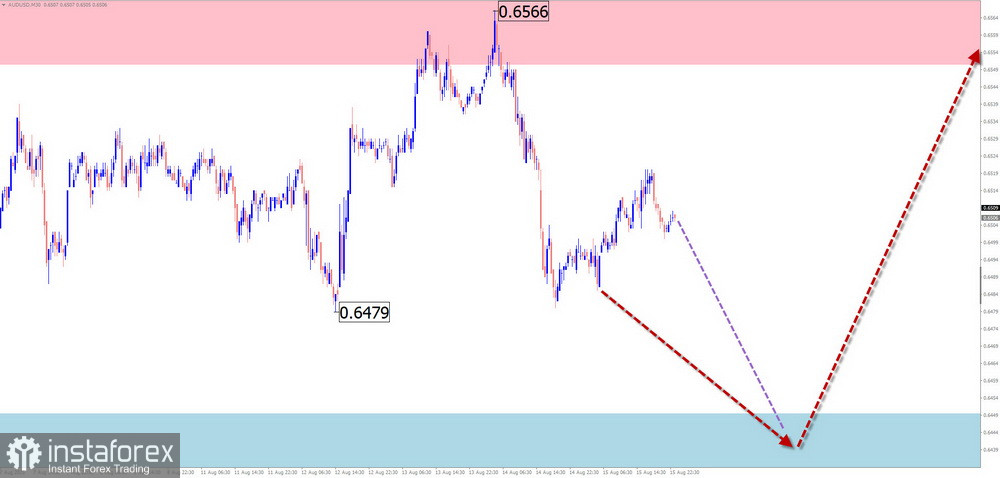
The bullish trend of the Australian dollar that started in April continues. Its corrective phase remains incomplete. The overall wave has the form of a shifting flat pattern. The upward section from July 30 does not exceed the retracement level.
Forecast:
At the start of the week, sideways movement is expected, with a likely decline to the lower boundary of the price corridor. Afterwards, the direction is expected to reverse, resuming the upward trend. The resistance zone represents the most probable upper boundary of the weekly move.
Potential Reversal Zones
- Resistance: 0.6550/0.6600
- Support: 0.6450/0.6400
Recommendations:
- Sell: No conditions for such trades at the moment.
- Buy: Irrelevant until confirmed signals appear near the support zone.
USD/CHF
Analysis:
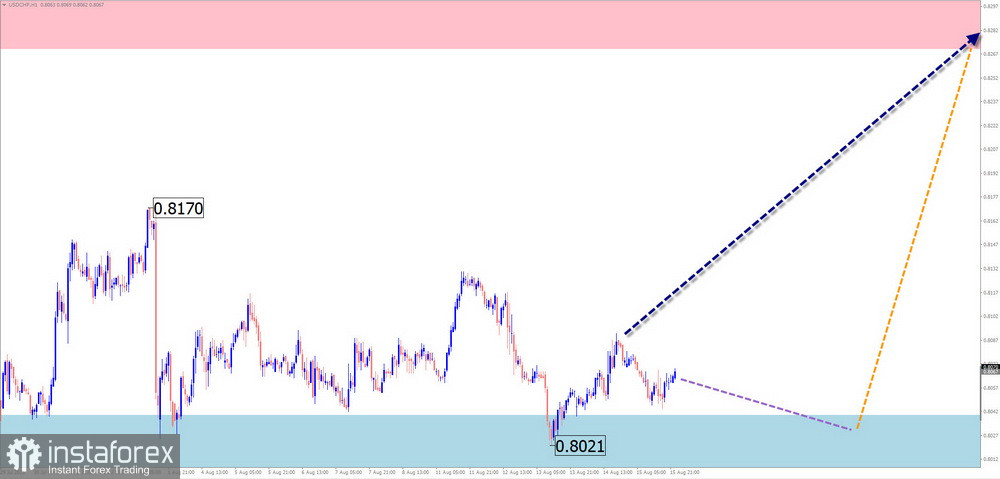
The Swiss franc pair continues to form an upward shifting flat pattern that began in April. The price has reached the upper boundary of a potential reversal zone. The bullish phase from August 1 exceeds the retracement level and has reversal potential.
Forecast:
At the beginning of the week, movement is expected to be mostly horizontal with a downward bias. Near the support zone, conditions for a reversal may form. A resumption of upward movement is likely by the end of the week.
Potential Reversal Zones
- Resistance: 0.8270/0.8320
- Support: 0.8040/0.7990
Recommendations:
- Buy: Premature until confirmed reversal signals appear near support.
- Sell: No conditions for trades in the coming days.
EUR/JPY
Analysis:
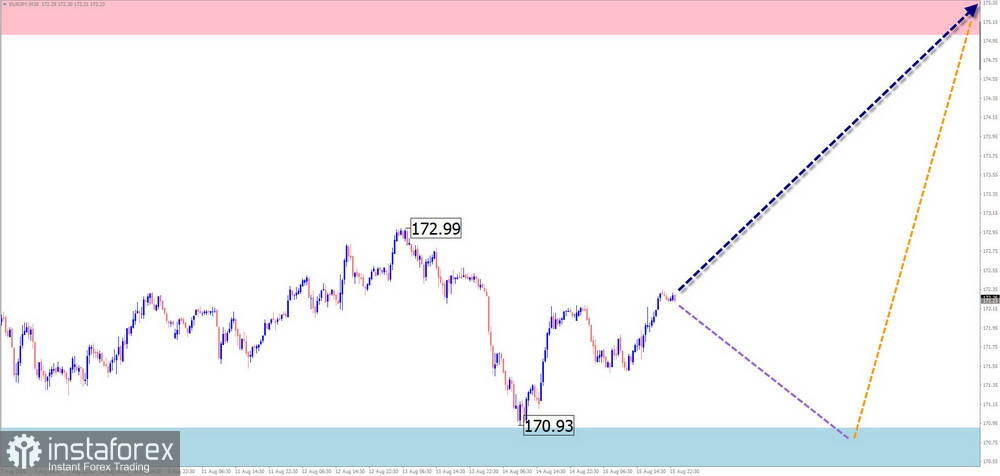
In the euro/yen pair, the global bullish trend sets the direction for short-term waves. The latest unfinished section began on August 5. Its structure does not yet appear complete. The corrective wave that started a month ago is nearing completion.
Forecast:
At the beginning of the week, the sideways move is expected to end, possibly with pressure on the support zone. A reversal and active growth are likely by the end of the week. Resistance marks the upper boundary of the expected weekly move.
Potential Reversal Zones
- Resistance: 175.00/175.50
- Support: 170.90/170.40
Recommendations:
- Sell: No potential.
- Buy: Not valid until confirmed signals appear near support.
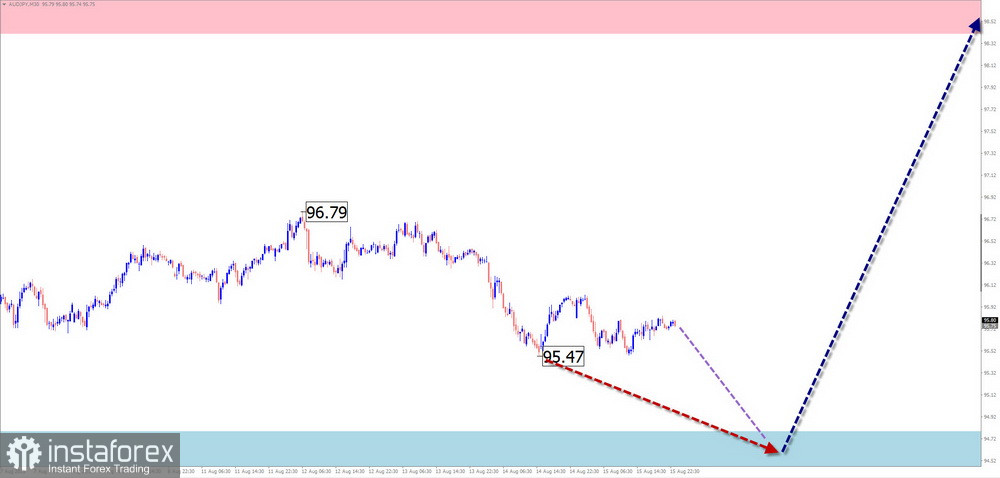
AUD/JPY
Analysis:
Since April last year, the Australian dollar/yen pair has been mostly moving downward. The current short-term wave, however, is upward. The corrective phase from August 5 is forming a shifting flat pattern, with the final part (C) still unfolding.
Forecast:
The coming week is expected to be generally flat. A downward move is more likely in the first days, followed by a price recovery toward the resistance zone by the end of the week.
Potential Reversal Zones
- Resistance: 98.40/98.90
- Support: 94.80/94.30
Recommendations:
- Sell: Possible with reduced volumes in individual sessions.
- Buy: Premature until confirmed signals appear near support.
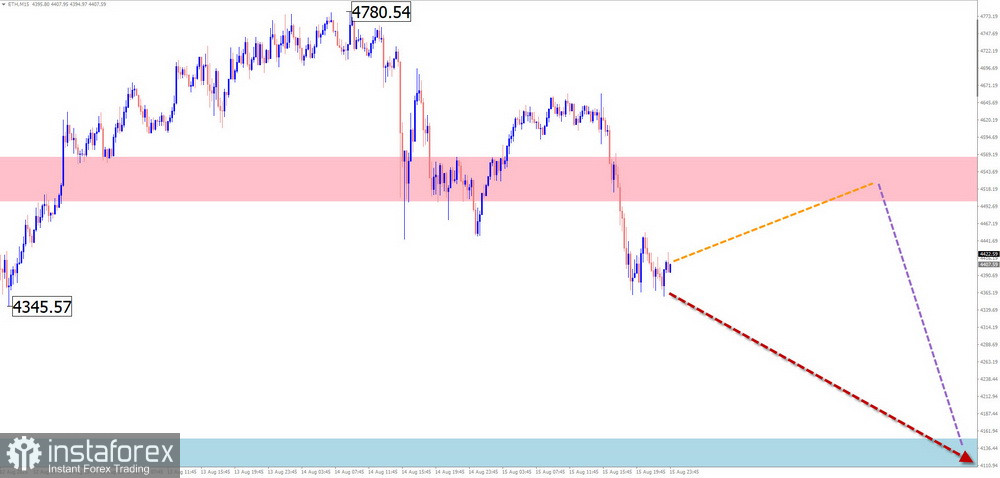
#Ethereum
Analysis:
Ethereum's upward wave that started in April has entered its final phase, lacking only the last segment. The price decline that began a week ago has formed a corrective wave. Once this correction is over, growth is expected to resume.
Forecast:
Next week, Ethereum's price is expected to gradually move from resistance toward support. Early in the week, sideways trading with an upward bias is likely. A change in direction may bring a spike in volatility and a breakout above resistance.
Potential Reversal Zones
- Resistance: 4500.0/4550.0
- Support: 4150.0/4100.0
Recommendations:
- Sell: Allowed within individual sessions with fractional volumes.
- Buy: No conditions until confirmed reversal signals appear near support.
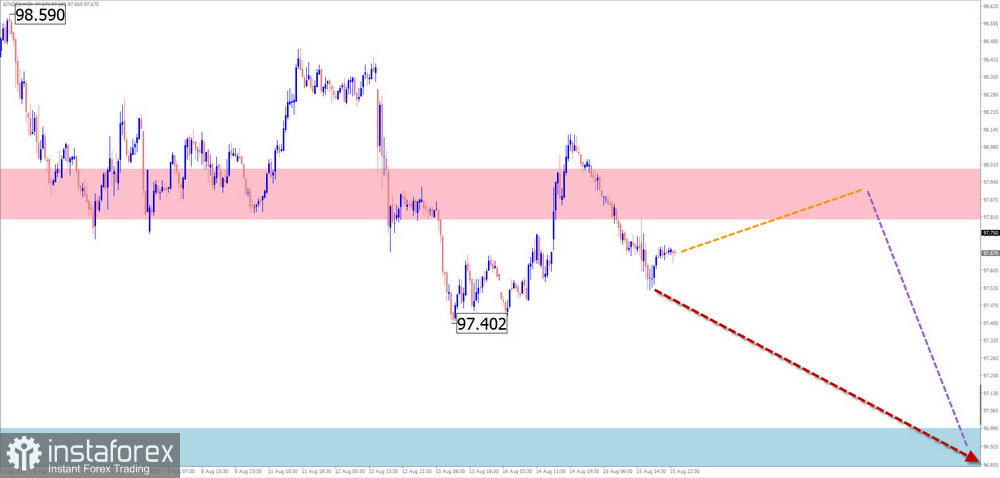
US Dollar Index
Analysis:
Several coinciding factors suggest that the U.S. dollar's downtrend, in place since January, has come to an end. The index is within a strong resistance zone. The counter-move, which began in mid-April, has the structure of a shifting flat and carries high wave potential, pointing at least to a full-fledged correction.
Forecast:
During the week, the dollar index is expected to continue sideways. A short-term rise is possible early in the week, with pressure on resistance. Stronger activity and a reversal are more likely toward the end of the week or the next.
Potential Reversal Zones
- Resistance: 97.80/98.00
- Support: 97.00/96.80
Recommendations:
The strengthening of national currencies in major pairs is likely to continue this week. The best trading results may be achieved by maintaining bullish trades in these pairs.
Notes: In simplified wave analysis (SWA), all waves consist of three parts (A-B-C). On each timeframe, only the last, unfinished wave is analyzed. Solid arrows indicate completed structures, dotted arrows show expected moves.
Attention: The wave algorithm does not account for the duration of price movements!