Trade Analysis of Wednesday:
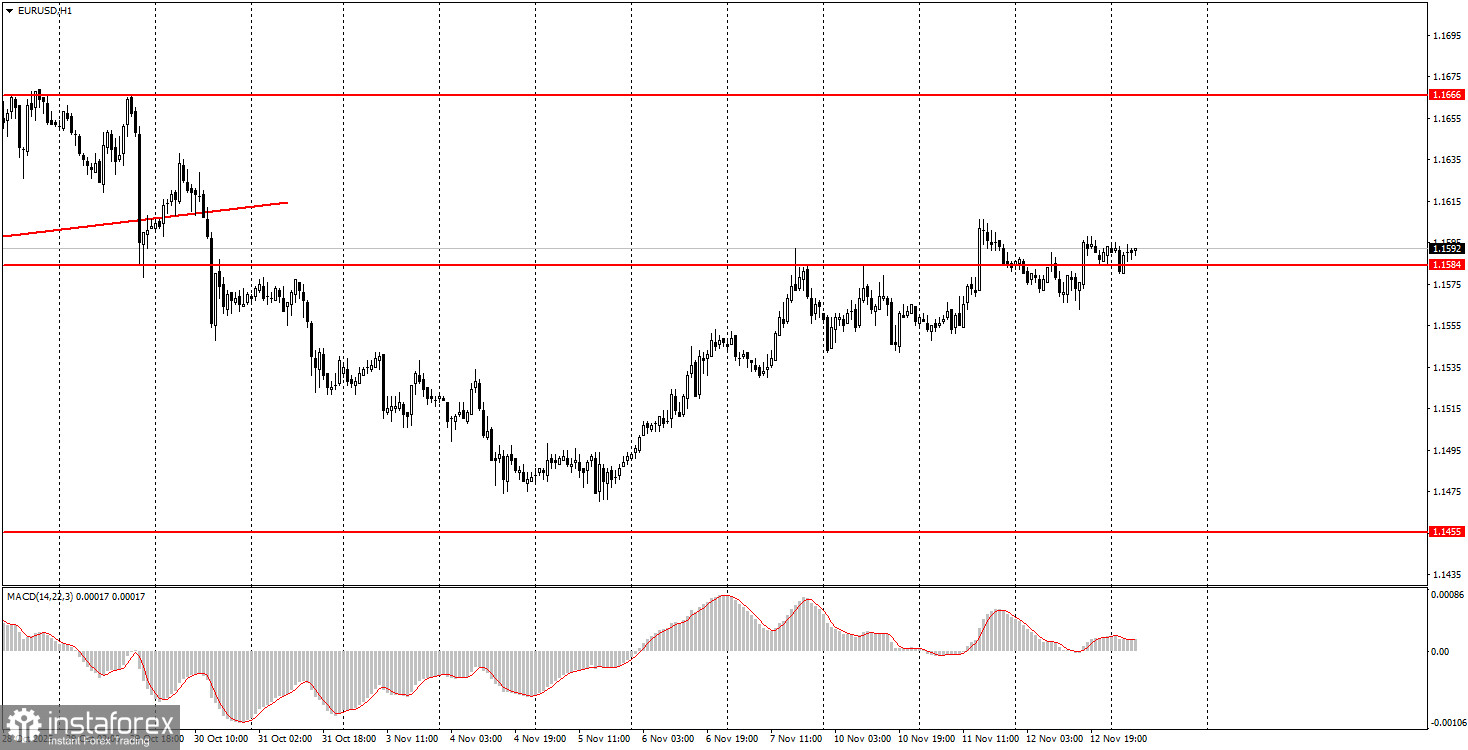
1H Chart of the EUR/USD Pair
On Wednesday, the EUR/USD currency pair continued to endure its trials. Recall that the euro has been experiencing a total flat for several months, which is clearly visible on the daily timeframe. Therefore, on the lower timeframes, we continue to observe frequently alternating trends, illogical movements, low volatility, and outright "empty" days. Yesterday's situation completely matched these signs. The macroeconomic background in the Eurozone and the US was essentially absent, resulting in volatility around 40 pips for the pair. We believe that the flat on the daily timeframe is the key aspect to prioritize when analyzing the EUR/USD pair. If the market is flat, then no fundamental events or macroeconomic reports will help achieve trend movement or high volatility. We view the flat as the calm before the storm, indicating that the market is preparing for a new trend.
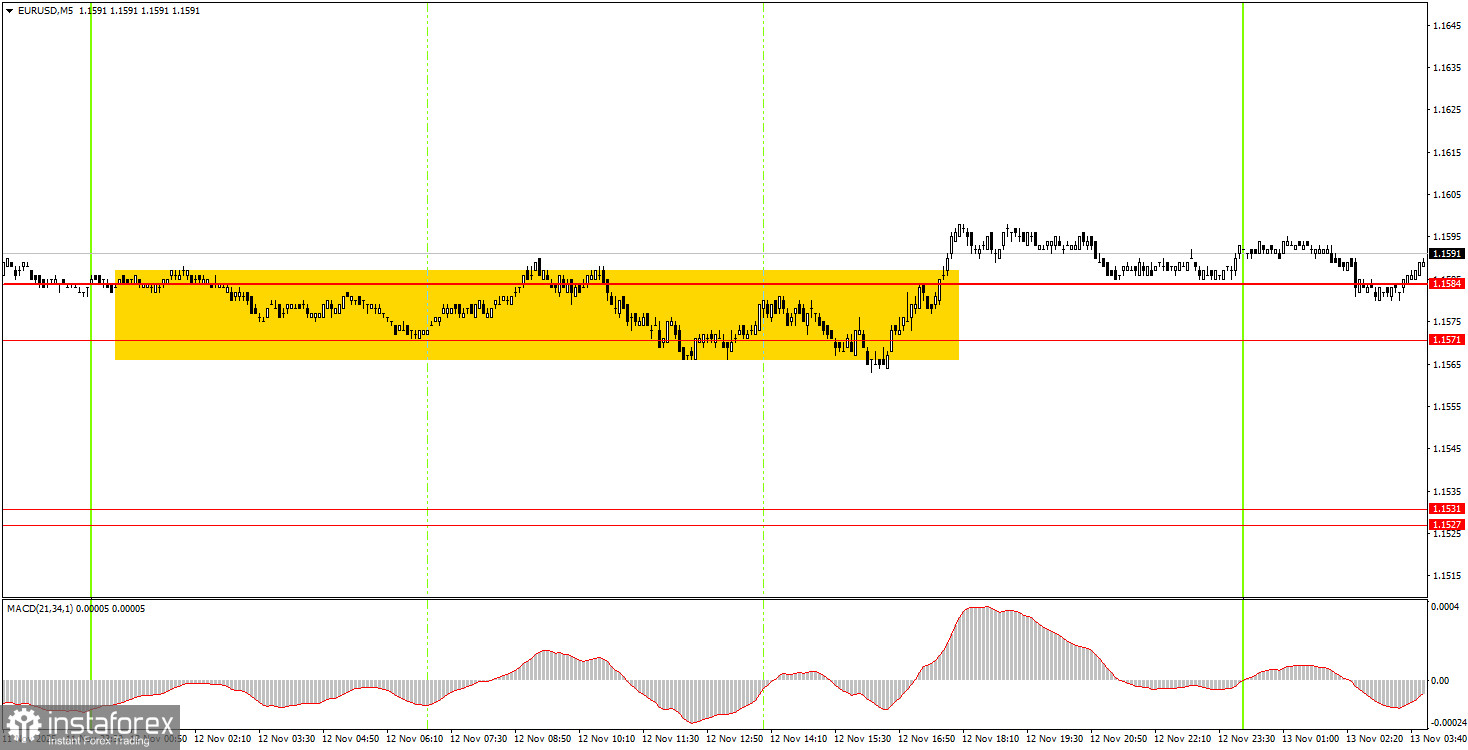
5M Chart of the EUR/USD Pair
On the 5-minute timeframe, the pair traded sideways nearly the entire day within the area of 1.1571-1.1584. Thus, we observed a total flat even on the 5-minute timeframe. The pair attempted to break out of this range several times, but it should be understood that all movements yesterday were simply market noise. During the American trading session, the price did manage to settle above the area, allowing novice traders to open long positions that can still be held, as the price remains relatively stagnant. However, a weak upward bias persists.
How to Trade on Thursday:
On the hourly timeframe, the EUR/USD pair still maintains a downward trend, but it may conclude soon. The overall fundamental and macroeconomic background remains very weak for the US dollar. Thus, only on technical grounds can the euro continue its decline – the flat on the daily timeframe remains relevant. However, we expect its conclusion and a resumption of the upward trend for 2025, with some upward movements even within the flat.
On Thursday, novice traders can again trade from the area of 1.1571-1.1584. A rebound from this area will allow for staying in long positions or opening new ones targeting 1.1655. A price consolidation below the 1.1571-1.1584 area will make short positions relevant, targeting 1.1527-1.1531.
On the 5-minute timeframe, levels to consider are 1.1354-1.1363, 1.1413, 1.1455-1.1474, 1.1527-1.1531, 1.1571-1.1584, 1.1655-1.1666, 1.1745-1.1754, 1.1808, 1.1851, 1.1908, 1.1970-1.1988. On Thursday, a report on industrial production in the Eurozone is scheduled for release, the only interesting event of the day. Even if this report shows a strong deviation from forecasts, it is unlikely to provoke a significant market reaction. Any market reaction is also unlikely to contribute to the flat's conclusion.
Key Principles of My Trading System:
- The strength of the signal is considered based on the time taken to form the signal (bounce or breach of a level). The less time taken, the stronger the signal.
- If two or more trades have been opened around a certain level based on false signals, all subsequent signals from that level should be ignored.
- In a flat market, any pair can create numerous false signals or may not form them at all. In any case, it's best to stop trading at the first signs of a flat.
- Trading deals are opened during the period between the start of the European session and the middle of the American session, after which all deals should be closed manually.
- On the hourly timeframe, it is preferable to trade based on signals from the MACD indicator only when there is good volatility and a trend that is confirmed by a trend line or trend channel.
- If two levels are too close to each other (between 5 and 20 pips), they should be treated as an area of support or resistance.
- After a 15-pip move in the right direction, a Stop Loss should be set to breakeven.
What the Charts Show:
- Support and resistance price levels are targets for opening buy or sell positions. Take Profit levels can be placed around them.
- Red lines indicate trend channels or trend lines, reflecting the current trend and indicating the preferred trading direction.
- The MACD indicator (14,22,3) — histogram and signal line — is a supplementary indicator that can also be used as a source of signals.
Important announcements and reports (always available in the news calendar) can significantly impact the movement of the currency pair. Therefore, during their release, it is recommended to trade with maximum caution or to exit the market to avoid sharp reversals against the preceding movement.
Beginners trading on the Forex market should remember that not every trade can be profitable. Developing a clear strategy and money management is key to long-term success in trading.