empty
 
 
04.09.2025 06:26 AM
How to Trade the EUR/USD Pair on September 4? Simple Tips and Trade Analysis for Beginners

Wednesday Trade Review:

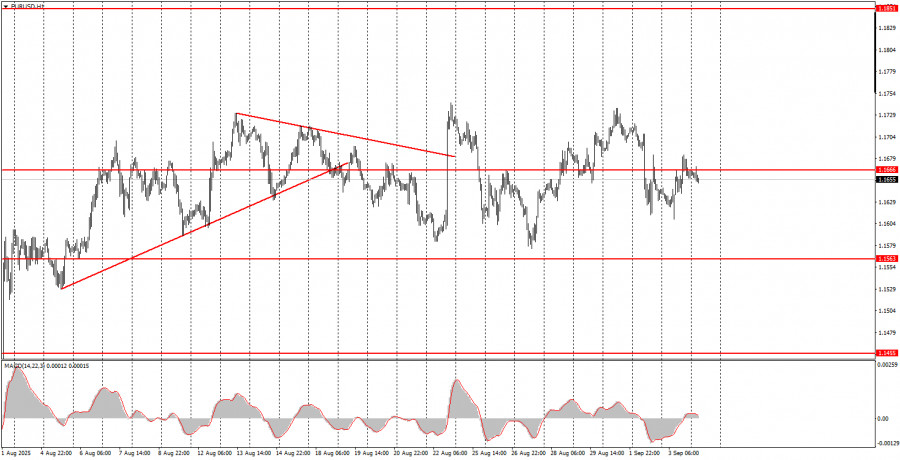
1H Chart of EUR/USD

This image is no longer relevant

On Wednesday, the EUR/USD currency pair recovered from Tuesday's decline, just as we had warned. There were no strong reasons for the euro's tumble on Tuesday, and as usual, that day's macroeconomic stats actually supported the euro. Recall that rising inflation in the Eurozone means the European Central Bank is extremely unlikely to enact even one more round of monetary easing in 2025. Also, recall that the euro performed well even when the ECB was actively cutting the key rate and the Federal Reserve remained silent. Now, in September, the situation may become exactly the opposite: the Fed may start cutting its key rate, while the ECB says nothing. How the dollar should react to such a scenario is probably obvious to everyone.

Also, on Tuesday, the ISM Manufacturing Index in the US delivered a weak reading, and on Wednesday, the JOLTs job openings report came out. Even though the JOLTs report is published with a two-month delay, it remains another indicator that has not pleased the dollar bulls. Thus, we still see no reason for the pair to fall or for the dollar to rise. On the hourly timeframe, the flat persists, which is clearly visible even from a kilometer away.

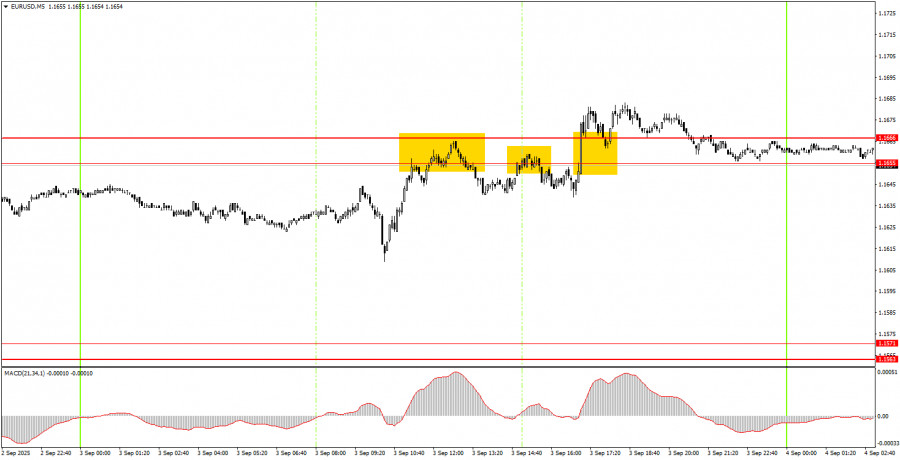
5M Chart of EUR/USD

This image is no longer relevant

On the 5-minute chart on Wednesday, three trade signals were generated. Novice traders could have attempted any of them. However, the flat persists, meaning you shouldn't expect trending moves or high volatility. The signals themselves were quite decent, but if the market doesn't move, no signals will help.

How to Trade on Thursday:

On the hourly chart, EUR/USD still has every chance to renew the uptrend that has been forming since the start of the year, but for now, the flat remains. The fundamental and macroeconomic backdrop remains unfavorable for the US dollar, so we still do not expect dollar strength. In our view, as before, the US currency can only count on technical corrections.

On Thursday, the EUR/USD pair may trade in either direction, as the price remains inside the sideways channel. Right now, the price is around the 1.1655–1.1666 area, so you can open positions from here. A consolidation below this area means selling with a target of 1.1590. A consolidation above means buys with a target of 1.1730.

On the 5-minute chart, the levels to watch are: 1.1198–1.1218, 1.1267–1.1292, 1.1354–1.1363, 1.1413, 1.1455–1.1474, 1.1527, 1.1552–1.1563–1.1571, 1.1655–1.1666, 1.1740–1.1745, 1.1808, 1.1851, 1.1908. On Thursday, the Eurozone will publish a not-so-important retail sales report, while in the US, the far more significant ISM Services PMI will be out. This index could trigger a fresh drop in the dollar if it comes in below expert forecasts.

Core Trading System Rules:

  1. Signal Strength: The shorter the time it takes for a signal to form (a rebound or breakout), the stronger the signal.
  2. False Signals: If two or more trades near a level result in false signals, subsequent signals from that level should be ignored.
  3. Flat Markets: In flat conditions, pairs may generate many false signals or none at all. It's better to stop trading at the first signs of a flat market.
  4. Trading Hours: Open trades between the start of the European session and the middle of the US session, then manually close all trades.
  5. MACD Signals: On the hourly timeframe, trade MACD signals only during periods of good volatility and a clear trend confirmed by trendlines or trend channels.
  6. Close Levels: If two levels are too close (5–20 pips apart), treat them as a support or resistance zone.
  7. Stop Loss: Set a Stop Loss to breakeven after the price moves 15 pips in the desired direction.

Key Chart Elements:

Support and Resistance Levels: These are target levels for opening or closing positions and can also serve as points for placing Take Profit orders.

Red Lines: Channels or trendlines indicating the current trend and the preferred direction for trading.

MACD Indicator (14,22,3): A histogram and signal line used as a supplementary source of trading signals.

Important Events and Reports: Found in the economic calendar, these can heavily influence price movements. Exercise caution or exit the market during their release to avoid sharp reversals.

Forex trading beginners should remember that not every trade will be profitable. Developing a clear strategy and practicing proper money management are essential for long-term trading success.

Summary
Urgency
Analytic
Stanislav Polyanskiy
Start trade
Gana con los cambios en el valor de las criptomonedas con InstaForex.
Descarga MetaTrader 4 y abre tu primera operación.
  • Grand Choice
    Contest by
    InstaForex
    InstaForex always strives to help you
    fulfill your biggest dreams.
    UNIRSE AL CONCURSO
  • Depósito al azar
    ¡Haga un depósito en su cuenta de $3,000 y obtenga $3000 más!
    ¡En Septiembre, sorteamos $3000 dentro de la campaña Depósito afortunado!
    Obtenga la oportunidad de ganar depositando $3,000 en una cuenta de operaciones. Tras haber cumplido esta condición, se convertirá en un participante de la campaña.
    UNIRSE AL CONCURSO
  • Opere de forma inteligente, gane un dispositivo
    Recargue su cuenta con al menos $500, regístrese en el concurso y tenga la oportunidad de ganar dispositivos móviles.
    UNIRSE AL CONCURSO
  • 100% de bonificación
    Su oportunidad única de obtener un bono del 100 % en su depósito
    OBTENER BONO
  • 55% de bonificación
    Solicite un bono del 55% en cada depósito
    OBTENER BONO
  • 30% de bonificación
    Reciba un bono del 30% cada vez que recargue su cuenta
    OBTENER BONO

Recommended Stories

¿No puede hablar ahora mismo?
Ingrese su pregunta en el chat.
Widget callback