The GBP/USD currency pair continued trading very low for most of the day on Monday. In the previous article, we mentioned that the "shutdown" in the US has now lasted 35 days, and that Republicans and Democrats are merely pretending to negotiate over funding. In reality, they are not. Interestingly, Donald Trump has already tried to pressure the Democrats by attempting to lay off several thousand government employees. His decision was blocked by the Supreme Court, which is expected to deliver another verdict in November regarding whether all of Trump's trade tariffs were lawful. If not, the Court must cancel them, leading to a "backlash" in the US with refunds of all customs payments that Trump's government has already collected.
Thus, the "shutdown" continues while the world awaits the Supreme Court's verdict. In the meantime, market attention on the standoff between Trump and the Federal Reserve has somewhat diminished. Many traders likely believe that the Fed has resumed its rate cuts, so now the US president does not need to criticize Jerome Powell weekly or attempt to fire any more current members of the FOMC. However, following the last FOMC meeting, the market interprets that the central bank may pause in December. How will Trump react to this pause? From our perspective, the answer is obvious.
It is also clear that the war between Trump and the Fed is not over. The Fed is indicating that it may conduct one or two more rounds of monetary easing, but its focus will soon shift back to inflation, which has been slowly rising in recent months. Thus, the absence of new "crossfire" between Trump and the Fed is merely a temporary lull.
Next year, Jerome Powell will step down, but only in May. When he leaves his position, a new head — presumably a Trump appointee — will take over. At that point, there will be four "active doves" among the twelve FOMC members. This is still too few to lower rates as desired by the Republicans. As soon as the Fed takes a pause, the flow of criticism and attempts to fire yet another insubordinate official will resume. The year 2026 promises to be even more interesting than 2025.
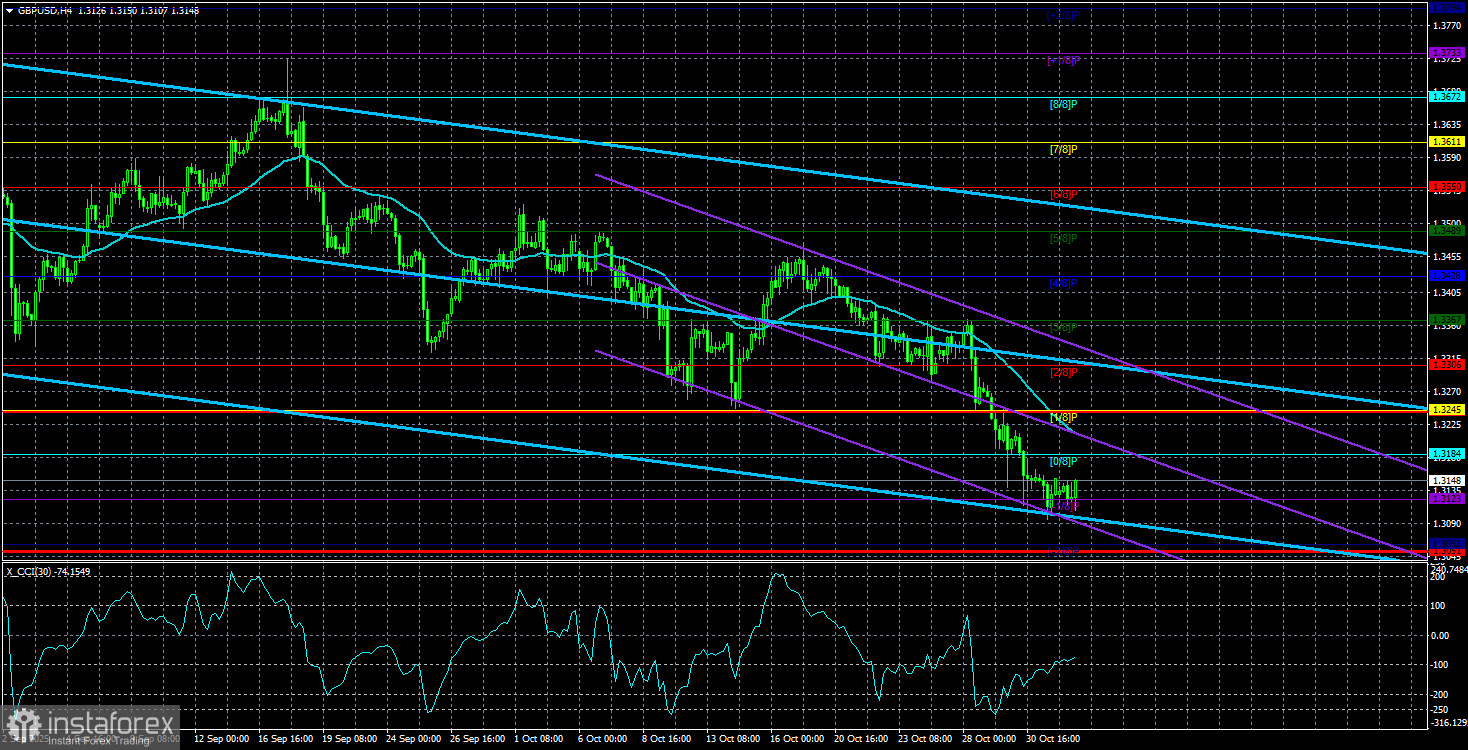
Given this fundamental backdrop, it remains unclear how the dollar can rise. Nevertheless, we continue to believe that on the daily timeframe, the flat pattern explains the pair's decline. In a flat market, the classic movement involves moving from one boundary of the channel to the other. This is what we have been witnessing over the past few months. Thus, at current price levels, we would proceed with extreme caution. We have previously advised against selling the pair, and now, especially with a high probability of a bounce from the lower boundary of the channel at 1.3140–1.3780, this guidance remains pertinent. We believe that trades can be opened when there are no contradictions in the market. Currently, there are plenty.

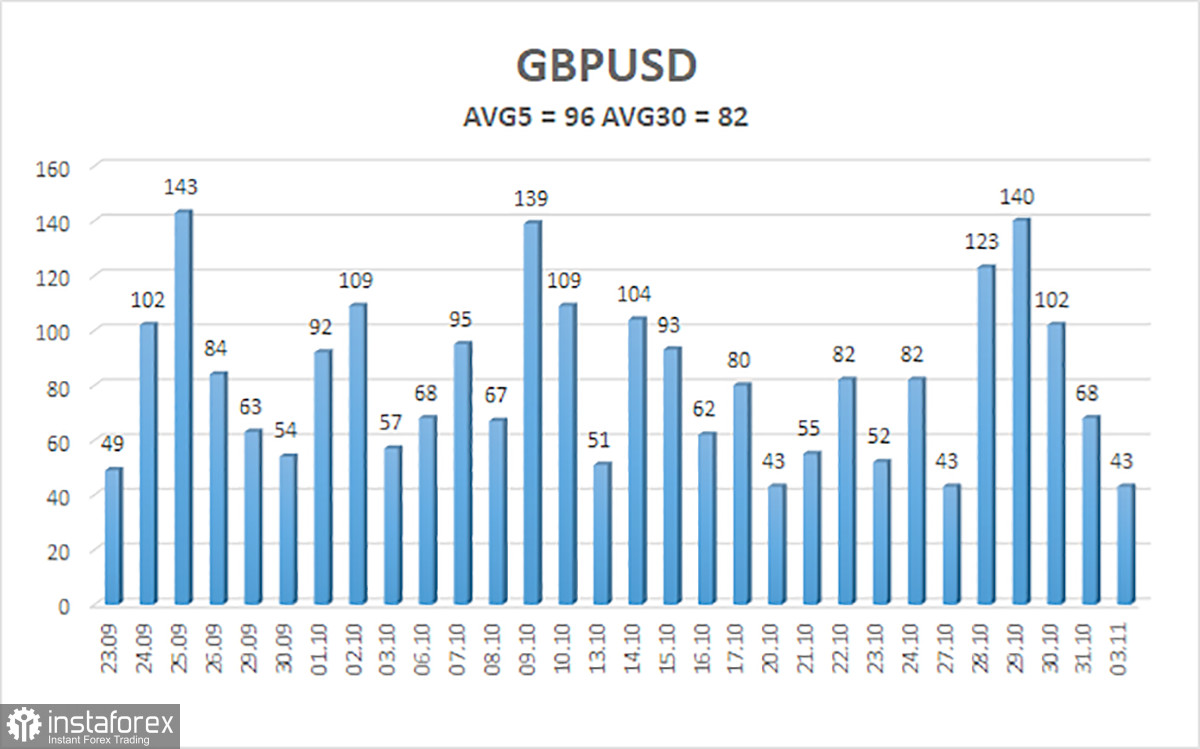
The average volatility of the GBP/USD pair over the last five trading days as of November 4 is 96 pips, characterized as "average." Therefore, we expect the pair to move within a range limited by the levels of 1.3051 and 1.3243 on Tuesday. The upper channel of linear regression is directed downwards, but only due to a four-month flat. The CCI indicator has entered oversold territory four times, suggesting a potential resumption of the upward trend.
Nearest Support Levels:
Nearest Resistance Levels:
- R1 – 1.3184
- R2 – 1.3245
- R3 – 1.3306
Trading Recommendations:
The GBP/USD currency pair is attempting to resume the upward trend of 2025, and its long-term prospects remain unchanged. Donald Trump's policies will continue to pressure the dollar, so we do not expect the American currency to appreciate. Currently, the daily timeframe still exhibits a flat pattern. Thus, long positions with targets of 1.3672 and 1.3733 remain much more relevant while the price is above the moving average. If the price is below the moving average line, minor shorts can be considered with targets of 1.3062 and 1.3051 based purely on technical grounds. Occasionally, the US dollar demonstrates corrections, but for any trend strengthening, it requires real signs of an end to the trade war or other global positive factors.
Explanations for the Illustrations:
- Support and resistance levels are indicated by thick red lines, near which movement may end. They are not sources of trading signals.
- Kijun-sen and Senkou Span B lines are Ichimoku indicator lines transferred from the 4-hour timeframe to the hourly timeframe. They are strong indicators.
- Extremum levels are marked by thin red lines where the price previously bounced. They are sources of trading signals.
- Yellow lines indicate trend lines, trend channels, and any other technical patterns.
- Indicator 1 on the COT charts shows the size of the net position for each category of traders.