empty
18.06.2025 03:34 PM
Wave analysis of BTC/USD on June 18. Bitcoin to clear up its overall impulse

This image is no longer relevant

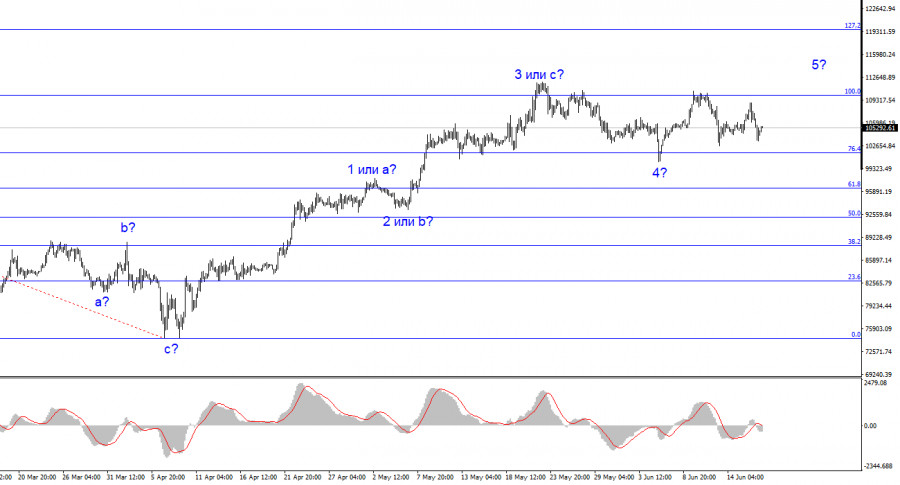
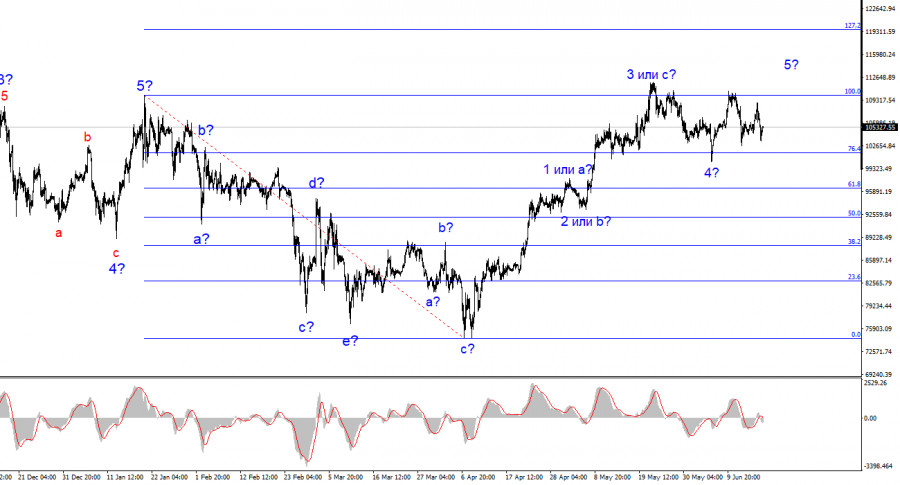
The wave pattern on the 4-hour chart of BTC/USD has become more complicated in recent months. We observed a corrective downward structure that completed near the $75,000 mark. After that, a rather strong upward movement began, which may be viewed as an impulsive bullish trend. The second wave in this segment appeared tiny and unconvincing. Therefore, I consider the current section to be impulsive in nature. If this assumption is correct, the trend still lacks a convincing wave 5, the peak of which should surpass the peak of wave 3. Based on this, I expect one more final upward impulse. A successful breakout through the 100.0% Fibonacci level would indicate a continuation of the bullish leg, which could potentially extend further under certain circumstances.

Market sentiment is driving Bitcoin, but fundamentals are inconsistent

The news backdrop occasionally supports Bitcoin, but not consistently. I would argue that market participants tend to interpret any news in favor of the leading cryptocurrency, or simply ignore the news altogether and keep buying. What we're witnessing is the development of an upward trend driven by emotion, demand, and belief in Bitcoin's sky-high future value. The rally from $75,000 to $111,000 exhibits all the classic signs of a "pump." But when a pump ends, decline begins.

The explanation is simple

BTC/USD has rallied considerably over the past two and a half months. Buyers only began facing resistance near the 100.0% Fibonacci level. Three failed attempts to break through this mark suggest the market is primed for another corrective wave. However, I still expect to see a more convincing wave 5 afterwards. Wave 5 could even extend further, but that can only be confirmed after a successful breakout beyond $110,000.

The news backdrop plays a relatively minor role in Bitcoin's development. I don't see any significant changes in recent weeks that would explain a drop in demand for Bitcoin. However, notably, the S&P 500 index has also struggled to rise recently. It seems that the leading instruments in both the US crypto and stock markets rebounded quickly after the first months of Donald Trump's return, but now lack a clear narrative for continued growth. I still believe the drop in February–March won't be the only one in 2025.

Geopolitical pressures intensify, but Bitcoin faces a technical ceiling

Tensions in the Middle East have escalated in recent weeks, while Donald Trump continues to pressure China and the European Union. As recently as yesterday, he renewed criticism toward Brussels, lamenting the EU's failure to offer a fair trade deal. Thus, US–EU trade negotiations remain stalled, and talks with Beijing show little progress or momentum. Still, these developments are not what stopped Bitcoin; rather, it was the $110,000 level.

This image is no longer relevant

Conclusion

Based on my analysis of BTC/USD, the bullish wave structure continues to develop, though it has a peculiar nature and shaky foundation. The recent price surge was not driven by strong fundamental news, and the $110,000 mark has halted bullish momentum for the fourth time in a row. Setting aside wave theory, one could argue that a new downward trend segment is forming. Accordingly, we may soon see at least a corrective wave targeting below the $100,200 mark. At the same time, we have yet to witness a convincing wave 5.

On a larger wave scale, the bullish trend segment is still unfolding, but its internal structure remains ambiguous due to the virtual absence of corrective waves.

Key principles of my wave analysis:

  • Wave structures should be simple and clear. Complex patterns are difficult to trade and often change.
  • If you are uncertain about the trend, it's better to stay out of the market.
  • There is no 100% certainty in a direction. Always use Stop Loss orders to protect your positions.
  • Wave analysis can be combined with other analytical methods and trading strategies for a more comprehensive approach.
Chin Zhao,
Analytical expert of InstaForex
© 2007-2025
Summary
Urgency
Analytic
Alexander Dneprovskiy
Start trade
通过InstaForex赚取加密货币汇率变动的收益。
下载MetaTrader 4并开启您的第一笔交易。
  • Grand Choice
    Contest by
    InstaForex
    InstaForex always strives to help you
    fulfill your biggest dreams.
    JOIN CONTEST

推荐文章

2025年7月25日,Solana上的死亡交叉指數移動平均(EMA)條件確認賣方仍然占主導地位,儘管可能會出現暫時的強勢。

Solana – 2025年7月25日,星期五 在EMA出現死亡交叉狀態且RSI(14)處於中性看跌狀態的情況下,Solana加密貨幣顯示賣家仍然佔優勢,因此今天的潛在疲軟仍然存在。 關鍵水平 1. 阻力位2:199.25。

Arief Makmur 12:03 2025-07-25 UTC+2

萊特幣的 RSI 指標出現背離現象,顯示其上行潛力可能會受限,直至 2025 年 7 月 25 日(星期五)的樞軸水平。

萊特幣 – 2025年7月25日,星期五 RSI(14) 指標與萊特幣價格走勢之間出現背離,顯示上升空間可能有限。RSI(14) 仍然處於中性看跌狀態,兩條EMA形成死亡交叉,顯示賣方的主導地位。

Arief Makmur 12:03 2025-07-25 UTC+2

比特幣暴跌至$115,000

遲早都會發生這件事。在比特幣勇敢地嘗試突破12萬美元之後,價格下跌至接近11萬5千美元。

Jakub Novak 09:41 2025-07-25 UTC+2

7月25日加密貨幣市場交易建議

比特幣暴跌,考驗115,000的標準,而以太坊則沒有面臨此類問題。 顯然,比特幣的急劇下跌不過是大市場參與者的獲利回吐。

Miroslaw Bawulski 09:13 2025-07-25 UTC+2

Tether 充滿信心地邁向進入美國市場

比特幣持續在116,500至120,000的區間波動,展現出穩定的波動性。然而,以太坊的表現則明顯較差,這是受到近期現貨ETF流入下降的影響。

Jakub Novak 10:07 2025-07-24 UTC+2

7月24日加密貨幣市場的交易建議

比特幣再次嘗試突破 $119,000,但未能成功,今天退回至 $117,000 水準。以太坊則跌回至 $3,600 之下,目前朝 $3,500 區域邁進,顯示在測試靠近 $3,800 的阻力位後,進一步修正。

Miroslaw Bawulski 09:20 2025-07-24 UTC+2

以太坊需求旺盛

最近幾週,Ethereum 表現出爆炸式增長,但仍未超過其歷史最高值。顯然,隨著新資金流入市場,Ethereum 正面臨需求的激增。

Jakub Novak 15:57 2025-07-23 UTC+2

現貨以太坊不斷吸收新資金

儘管以太幣跌破了3,700美元大關,但以太坊現貨ETF的資金淨流入昨日達到5.339億美元,為自其推出以來第三大單日流入量。 根據SoSoValue的數據,BlackRock的iShares Ethereum Trust(ETHA)在週二錄得4.262億美元的資金淨流入,而Grayscale的Ethereum Mini Trust吸引了7,260萬美元的資金。

Jakub Novak 12:07 2025-07-23 UTC+2

7月23日加密貨幣市場交易建議

比特幣再次突破119,000美元,短暫超過了120,000美元大關,但隨後回撤至約118,500美元。這顯示出回到接近123,000美元的歷史高位面臨相當大的困難。

Miroslaw Bawulski 09:18 2025-07-23 UTC+2

加密貨幣市場:山寨幣季節勢頭增強

加密貨幣市場正顯示出進入新一輪山寨幣季節的強烈跡象——這是一段山寨幣加速增長的時期。七月中旬,DOGE/USD 匹配回到了中期牛市區,同時仍然處於長期和全球看漲趨勢中。

Jurij Tolin 16:46 2025-07-22 UTC+2
现在无法通话?
提出您的问题,用 在线帮助.
Widget callback
 

Dear visitor,

Your IP address shows that you are currently located in the USA. If you are a resident of the United States, you are prohibited from using the services of InstaFintech Group including online trading, online transfers, deposit/withdrawal of funds, etc.

If you think you are seeing this message by mistake and your location is not the US, kindly proceed to the website. Otherwise, you must leave the website in order to comply with government restrictions.

Why does your IP address show your location as the USA?

  • - you are using a VPN provided by a hosting company based in the United States;
  • - your IP does not have proper WHOIS records;
  • - an error occurred in the WHOIS geolocation database.

Please confirm whether you are a US resident or not by clicking the relevant button below. If you choose the wrong option, being a US resident, you will not be able to open an account with InstaForex anyway.

We are sorry for any inconvenience caused by this message.