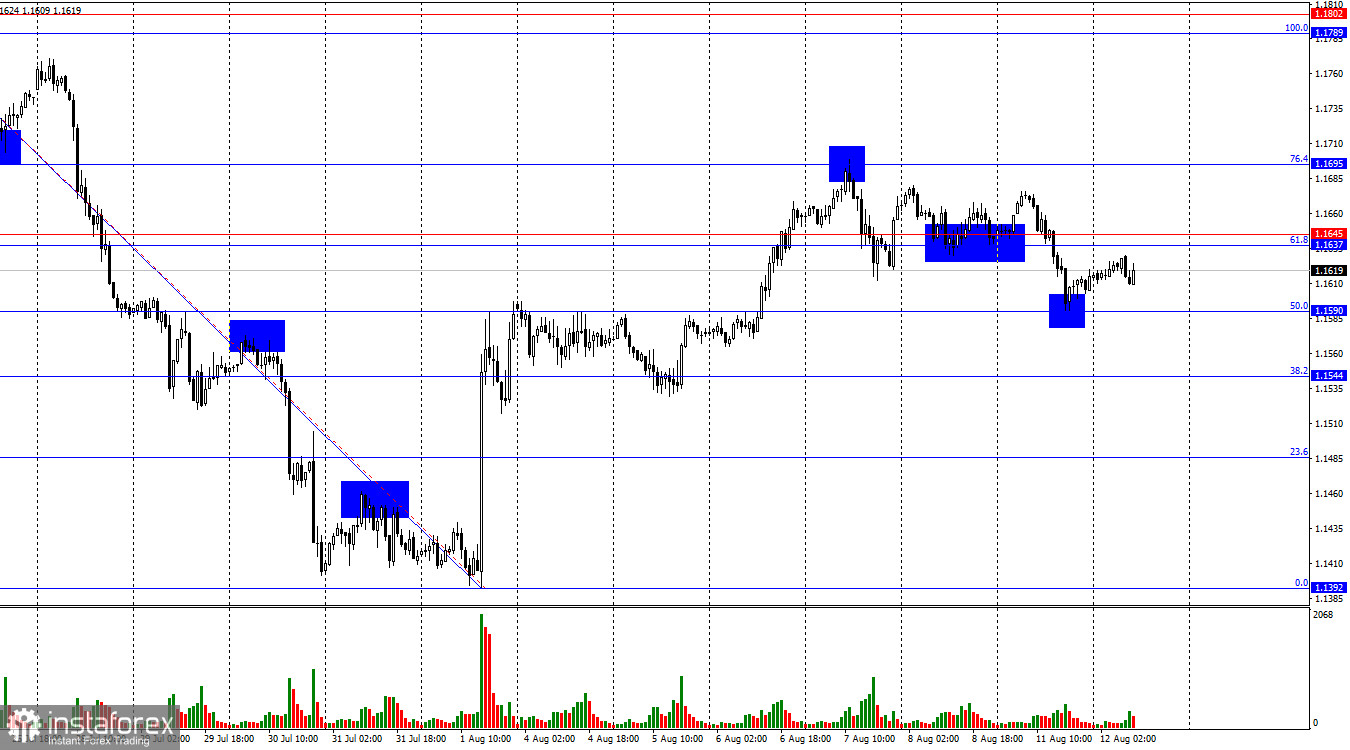
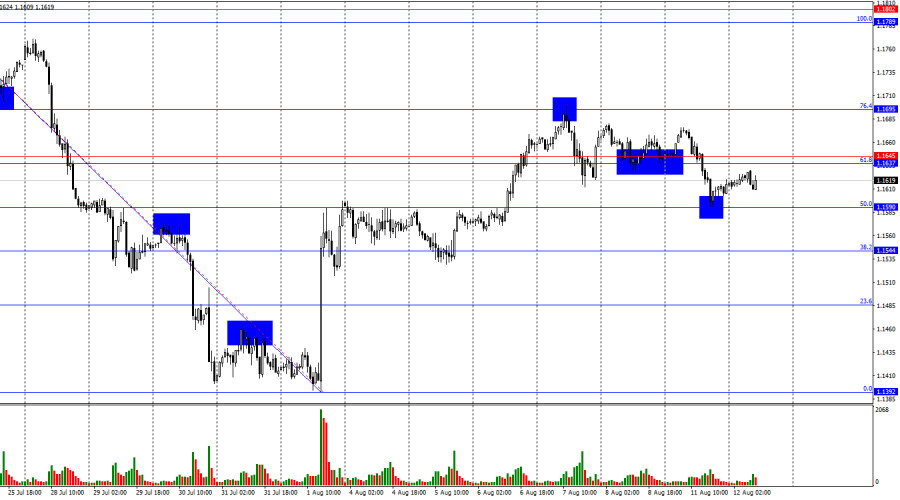
On Monday, the EUR/USD pair declined to the 50.0% retracement level at 1.1590 and rebounded from it. As a result, a reversal in favor of the euro was completed. The upward movement may continue toward the resistance zone of 1.1637–1.1645. Consolidation above this zone would favor further growth toward the levels of 1.1695 and 1.1789. A rebound from the 1.1637–1.1645 zone would favor the U.S. currency and a continuation of the decline toward the levels of 1.1590 and 1.1544.
The wave structure on the hourly chart remains straightforward. The last completed upward wave broke the high of the previous wave, while the last completed downward wave broke the previous low. Therefore, the trend can be considered "bearish" for now, but recently it has been changing frequently due to the news background. Donald Trump managed to sign several favorable deals, which supported the bears, as did Jerome Powell's statements after the latest Fed meeting. However, recent labor market data and the changed outlook for Fed monetary policy now support the bulls.
On Monday, there was no significant news background, but the bears still made an attempt to push the pair lower. The move was weak, as today's U.S. inflation report is highly anticipated. This report may influence the FOMC's decision at its next meeting. At present, traders expect a rate cut at the September FOMC meeting, but will policymakers be ready to vote for a cut if inflation rises to, for example, 3%? In my view, the answer is not straightforward. If inflation comes in high today, the chances of monetary policy easing in September will likely decrease. The stronger the inflation increases, the lower the chances. Thus, high inflation would support the bears. At this point, an increase in U.S. inflation seems the most likely outcome.
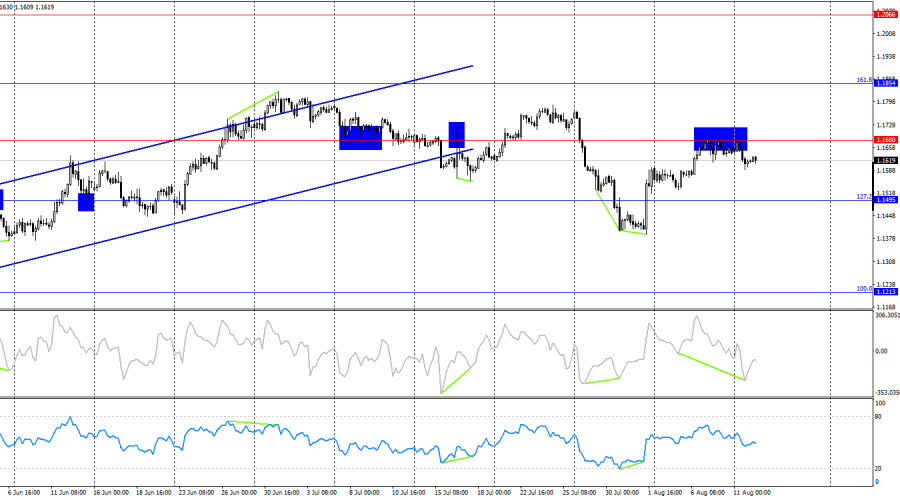
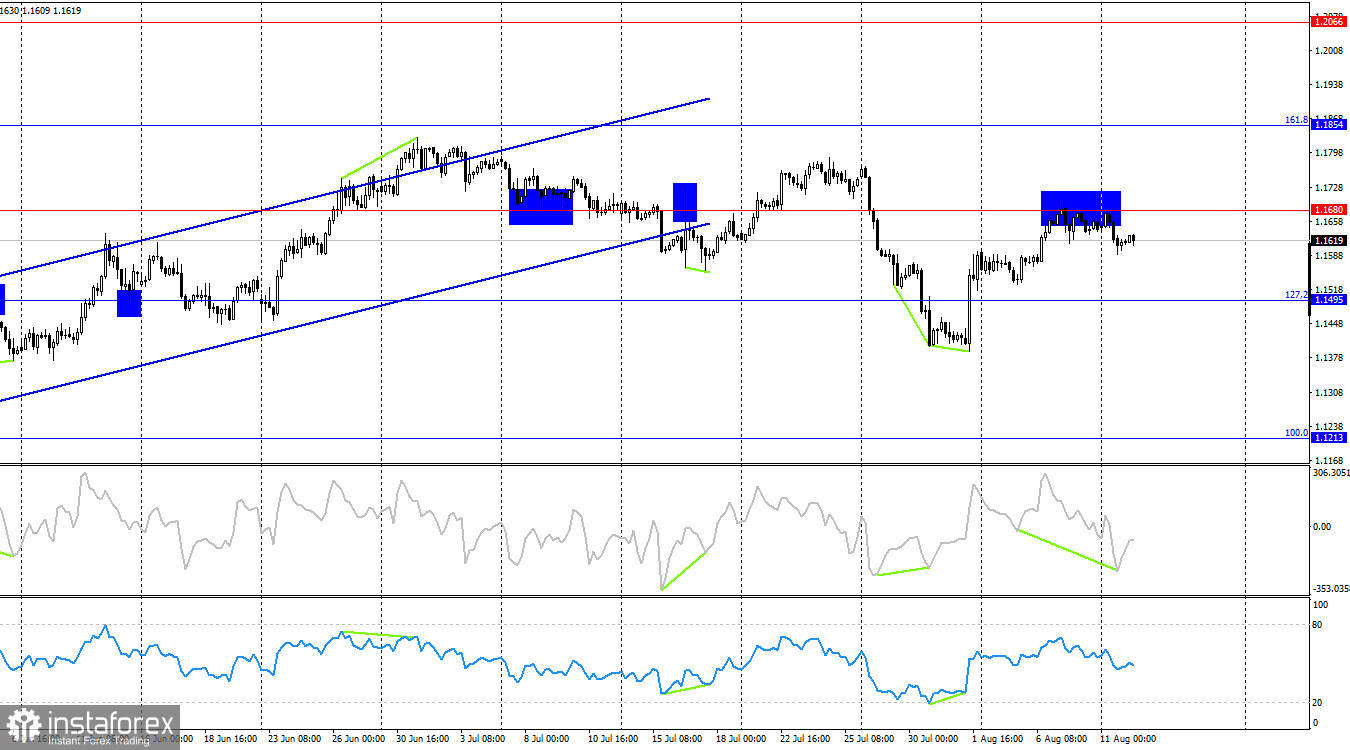
On the four-hour chart, the pair reversed in favor of the euro and rose to the 1.1680 level after forming two bullish divergences. A rebound from this level suggests a possible decline toward the 127.2% retracement level at 1.1495. Consolidation above 1.1680 would increase the likelihood of continued growth toward the next Fibonacci level of 161.8% at 1.1854. No emerging divergences are currently observed on any indicator, and a move below the ascending channel does not necessarily mean a bearish trend will form.
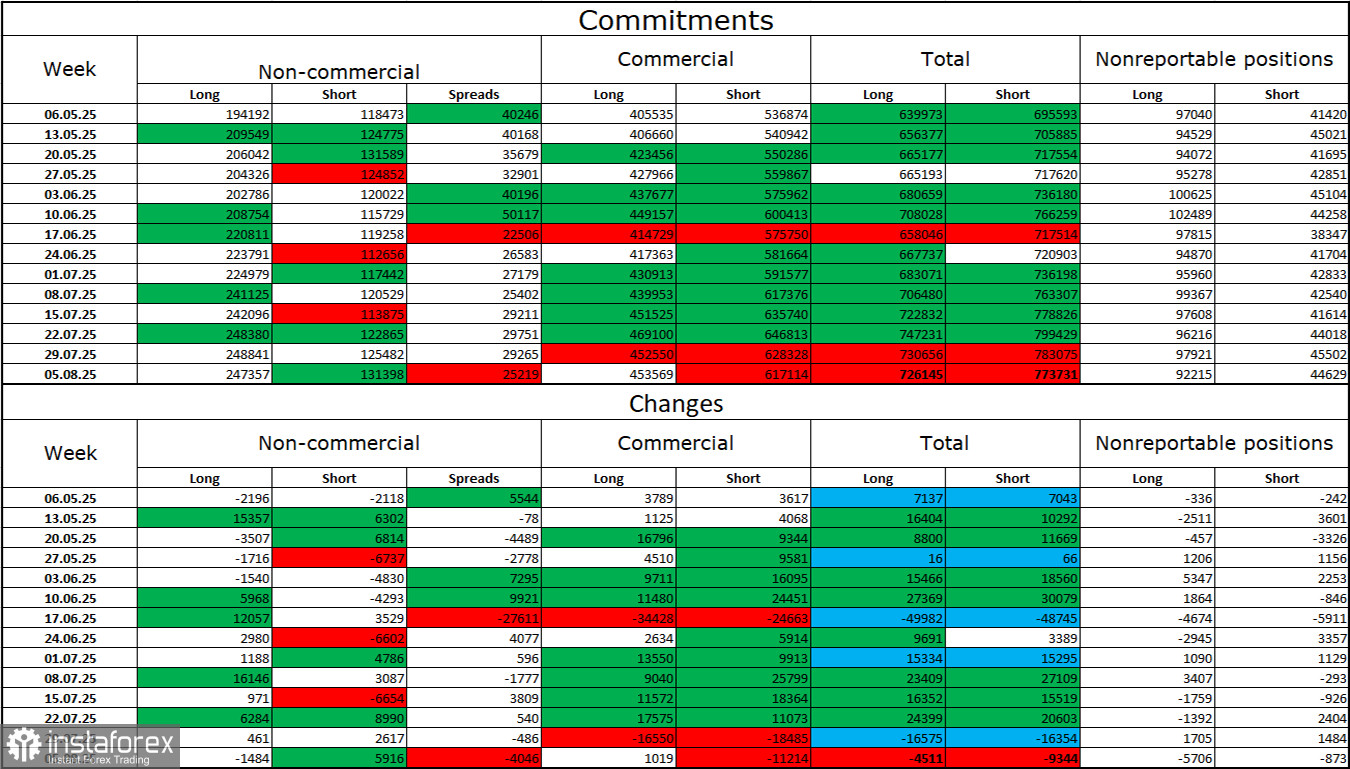
Commitments of Traders (COT) report:
Over the last reporting week, professional traders closed 1,848 long positions and opened 5,916 short positions. The sentiment of the "Non-commercial" group remains bullish, largely due to Donald Trump's policies, and is strengthening over time. The total number of long positions held by speculators now stands at 247,000, compared to 131,000 short positions — almost a twofold difference. In addition, note the large number of green cells in the table above, indicating a strong build-up of positions in the euro. In most cases, interest in the euro is growing while interest in the dollar is declining.
For 26 consecutive weeks, large market players have been reducing their short positions and increasing their longs. Donald Trump's policies remain a major factor for traders, as they could create long-term and structural challenges for the U.S. economy. Despite signing several important trade agreements, some key economic indicators are showing declines.
News calendar for the U.S. and Eurozone:
Eurozone – ZEW Economic Sentiment Index (09:00 UTC). Germany – ZEW Economic Sentiment Index (09:00 UTC). U.S. – Consumer Price Index (12:30 UTC).
On August 12, the economic calendar contains three entries, one of which is considered important. The news background is expected to influence market sentiment in the second half of the day.
EUR/USD forecast and trading tips:
Selling the pair was possible upon an hourly close below the 1.1637–1.1645 zone with targets at 1.1590 and 1.1544. The first target has been reached. Today, sales are possible with the same targets in case of a rebound from the 1.1637–1.1645 zone. Buying could be initiated from a rebound off 1.1590 on the hourly chart. Today, such positions can be held with targets at 1.1637 and 1.1695.
Fibonacci grids are built from 1.1789 to 1.1392 on the hourly chart and from 1.1214 to 1.0179 on the four-hour chart.