empty
 
 
01.09.2025 09:27 AM
The Market Is Expensive. But Not All of It

History is written by the victors. Until the Appeals Court ruled the White House tariffs illegal, markets hung on Donald Trump's every word. Often, poor US economic data or uncertainty from trade policy was ignored in favor of optimistic stories from the President and administration officials. As a result, fundamental valuations of S&P 500 companies have climbed so high that the risk of a correction in the broad equity index is snowballing.

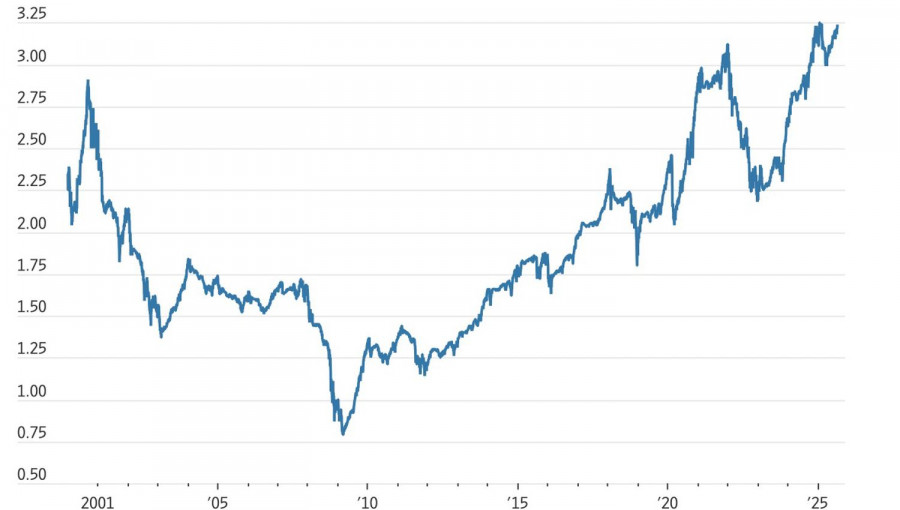
If everyone's doing the same thing, where will S&P 500 bulls come from when the stock market begins a major pullback? Buying the dip works, but only up to a point. The broad index is trading at 3.23 times every dollar of company revenue—an all-time high. The price-to-expected-earnings ratio for the next 12 months is 22.5—not the highest in history, but well above the average of 16.8 since 2000.

S&P 500 Price-to-Sales Ratio Trends

This image is no longer relevant

Not all companies are expensive. Nine members of the S&P 500 have a market cap exceeding $1 trillion. The share of the TOP 10 by market value accounts for 39.5% of the broad index—another record. Many believe that tech stocks, led by NVIDIA, justify their valuations. However, their profits will not continue to grow at such an exponential rate forever. Investors will wait for this, but ultimately, disappointment will lead to a correction.

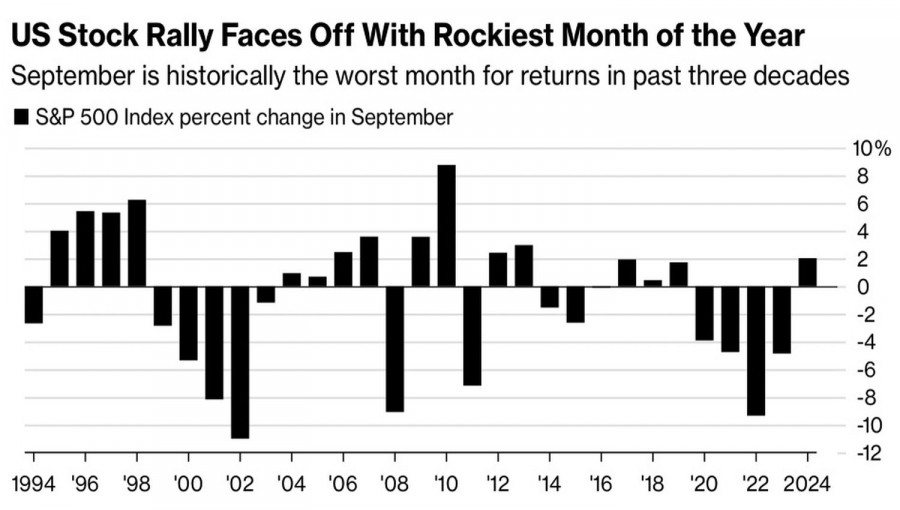
It's quite possible the market could become turbulent in September. Over the past 30 years, the S&P 500 has lost an average of 0.7% in the first month of autumn. Moreover, it registered monthly declines in four of the last five years.

S&P 500's September Performance

This image is no longer relevant

According to Yardeni Research, even a Federal Reserve funds rate cut in September could negatively impact the broad index. The threat of accelerating US inflation will hang over the S&P 500 like the sword of Damocles. The firm believes the stock market's reaction to August employment figures could be unpredictable. Strong data will reduce the chances of the Fed resuming a monetary easing cycle; weak data will confirm that the US economy is cooling. Both outcomes are bad for equities.

This image is no longer relevant

Further confusion comes from the Appeals Court's ruling that Trump's tariffs were illegal. Will their removal help the US economy? Or will it hurt, since the US might have to return billions collected in tariffs?

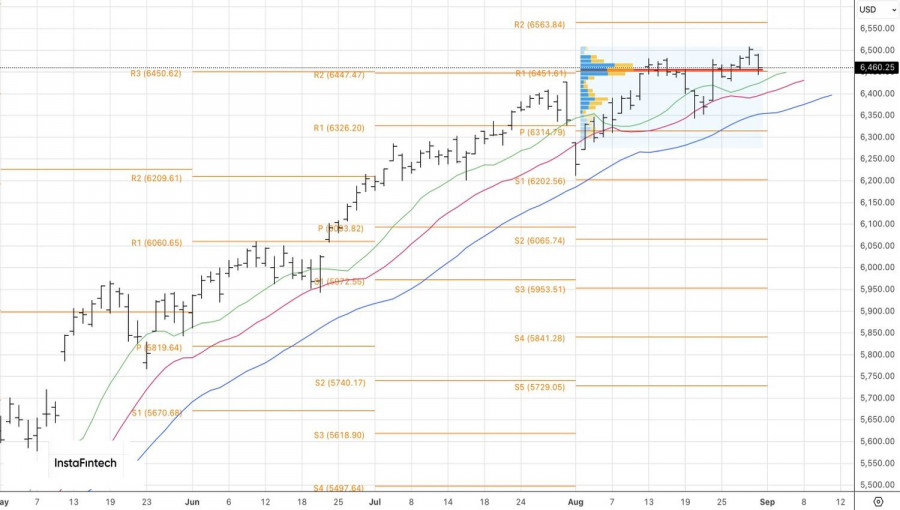
Technically, on the daily S&P 500 chart, we are seeing a return to fair value at 6450. As previously indicated, this increases the risk of a pullback. It may start due to the "Three Indians" reversal pattern. The 6450 mark is a kind of red line: a fall below it would be a signal to sell; a bounce—an invitation to buy.

Marek Petkovich,
Analytical expert of InstaForex
© 2007-2025
Summary
Urgency
Analytic
Igor Kovalyov
Start trade
Earn on cryptocurrency rate changes with InstaForex
Download MetaTrader 4 and open your first trade
  • Grand Choice
    Contest by
    InstaForex
    InstaForex always strives to help you
    fulfill your biggest dreams.
    JOIN CONTEST
  • Chancy Deposit
    Deposit your account with $3,000 and get $3000 more!
    In September we raffle $3000 within the Chancy Deposit campaign!
    Get a chance to win by depositing $3,000 to a trading account. Having fulfilled this condition, you become a campaign participant.
    JOIN CONTEST
  • Trade Wise, Win Device
    Top up your account with at least $500, sign up for the contest, and get a chance to win mobile devices.
    JOIN CONTEST
  • 100% Bonus
    Your unique opportunity to get a 100% bonus on your deposit
    GET BONUS
  • 55% Bonus
    Apply for a 55% bonus on your every deposit
    GET BONUS
  • 30% Bonus
    Receive a 30% bonus every time you top up your account
    GET BONUS

Recommended Stories

Can't speak right now?
Ask your question in the chat.
Widget callback